Everything below is shipped and working today — this page is updated with every release.
📥
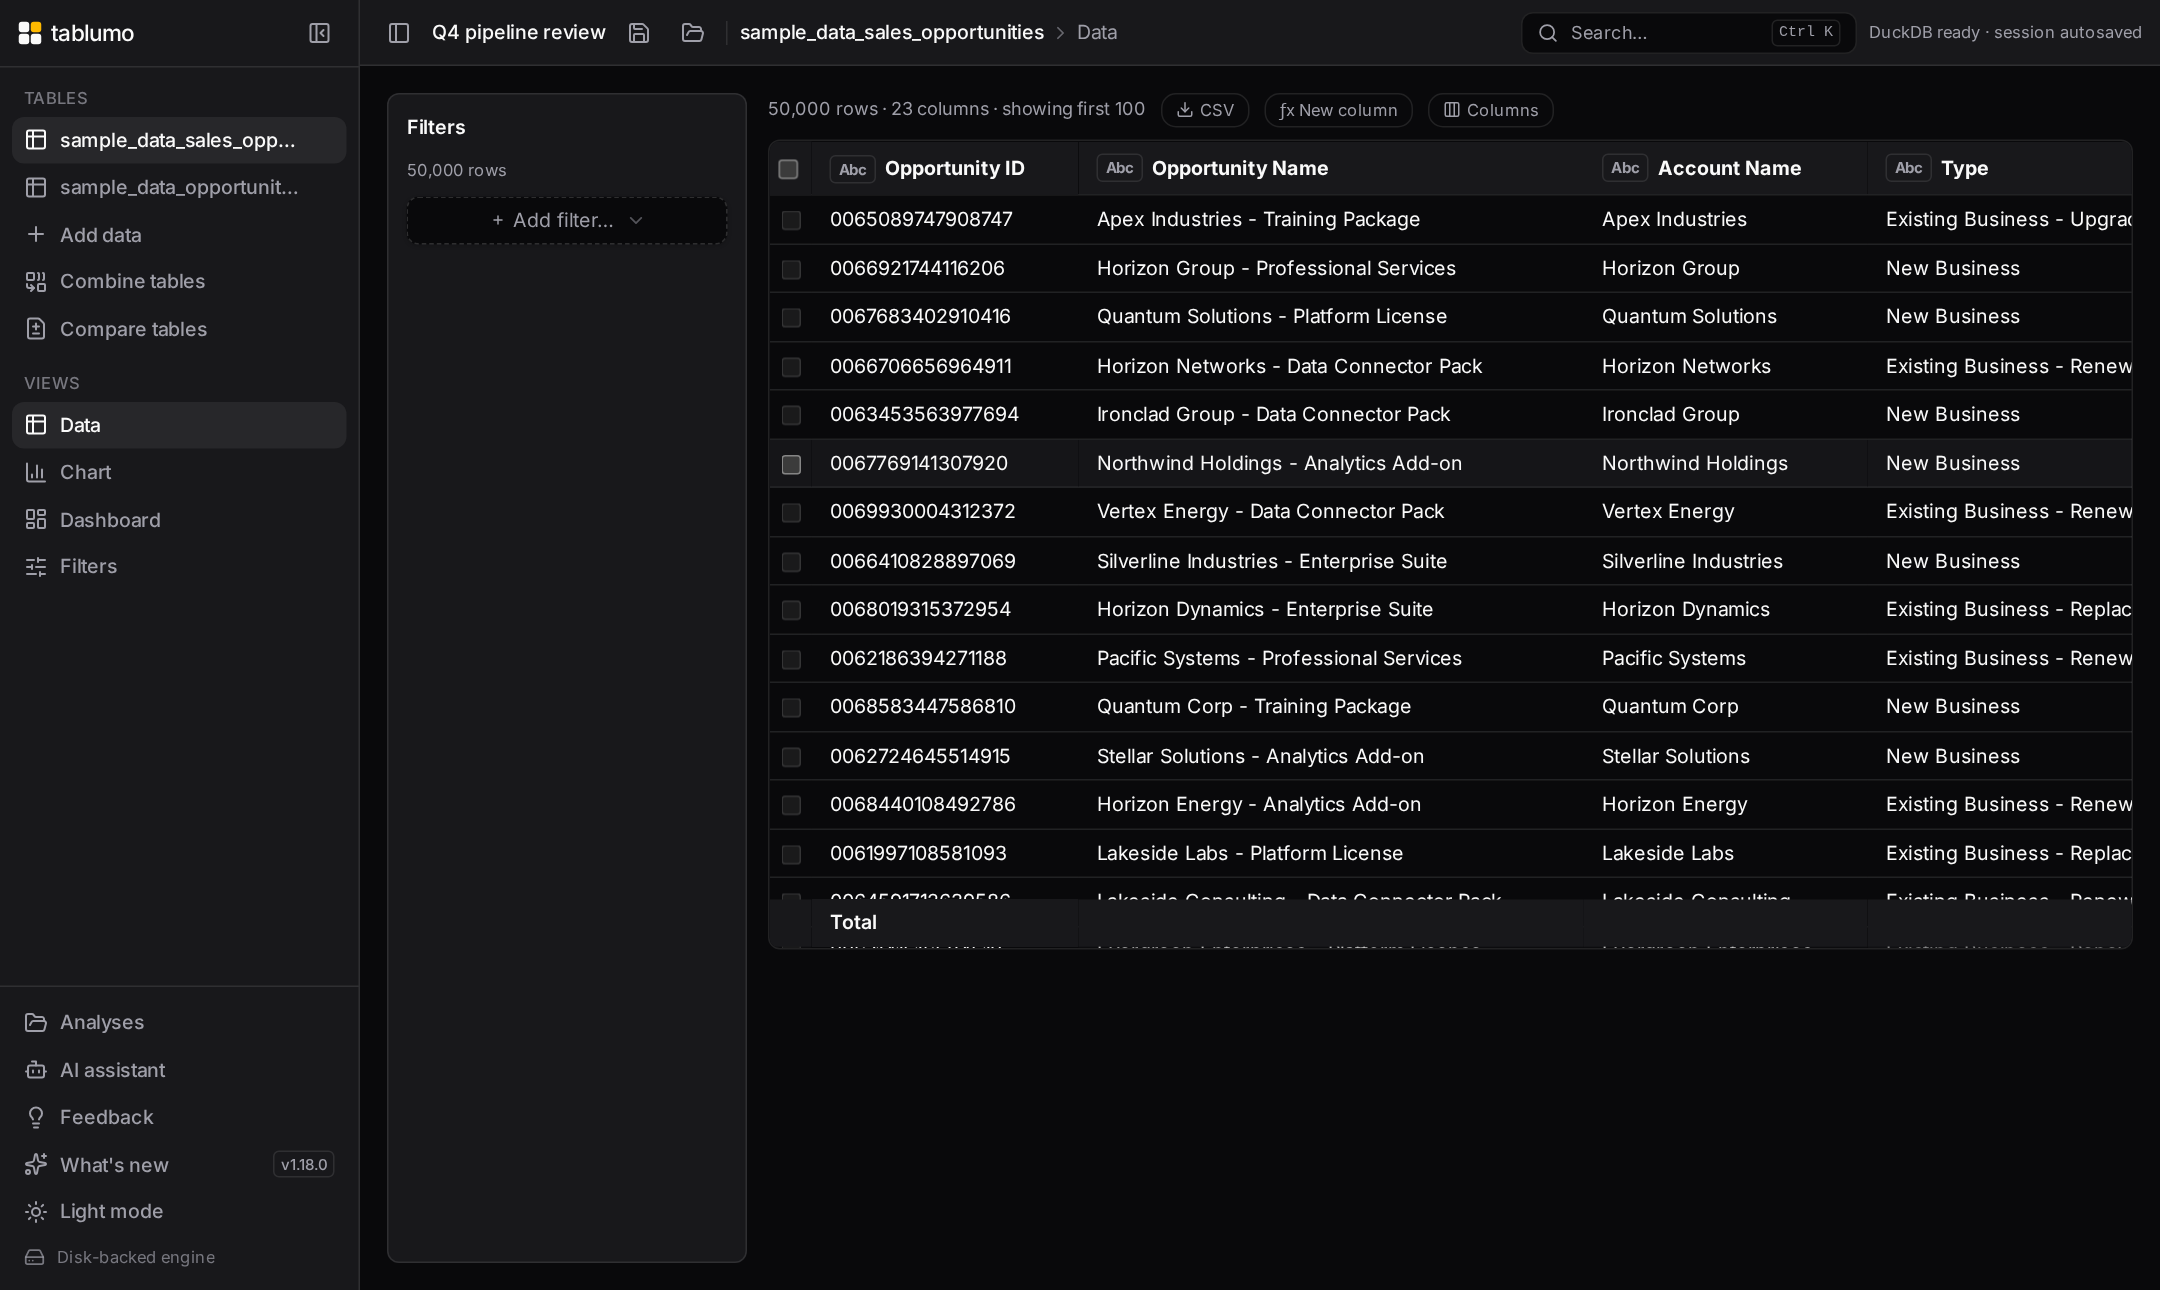
CSV & Excel import
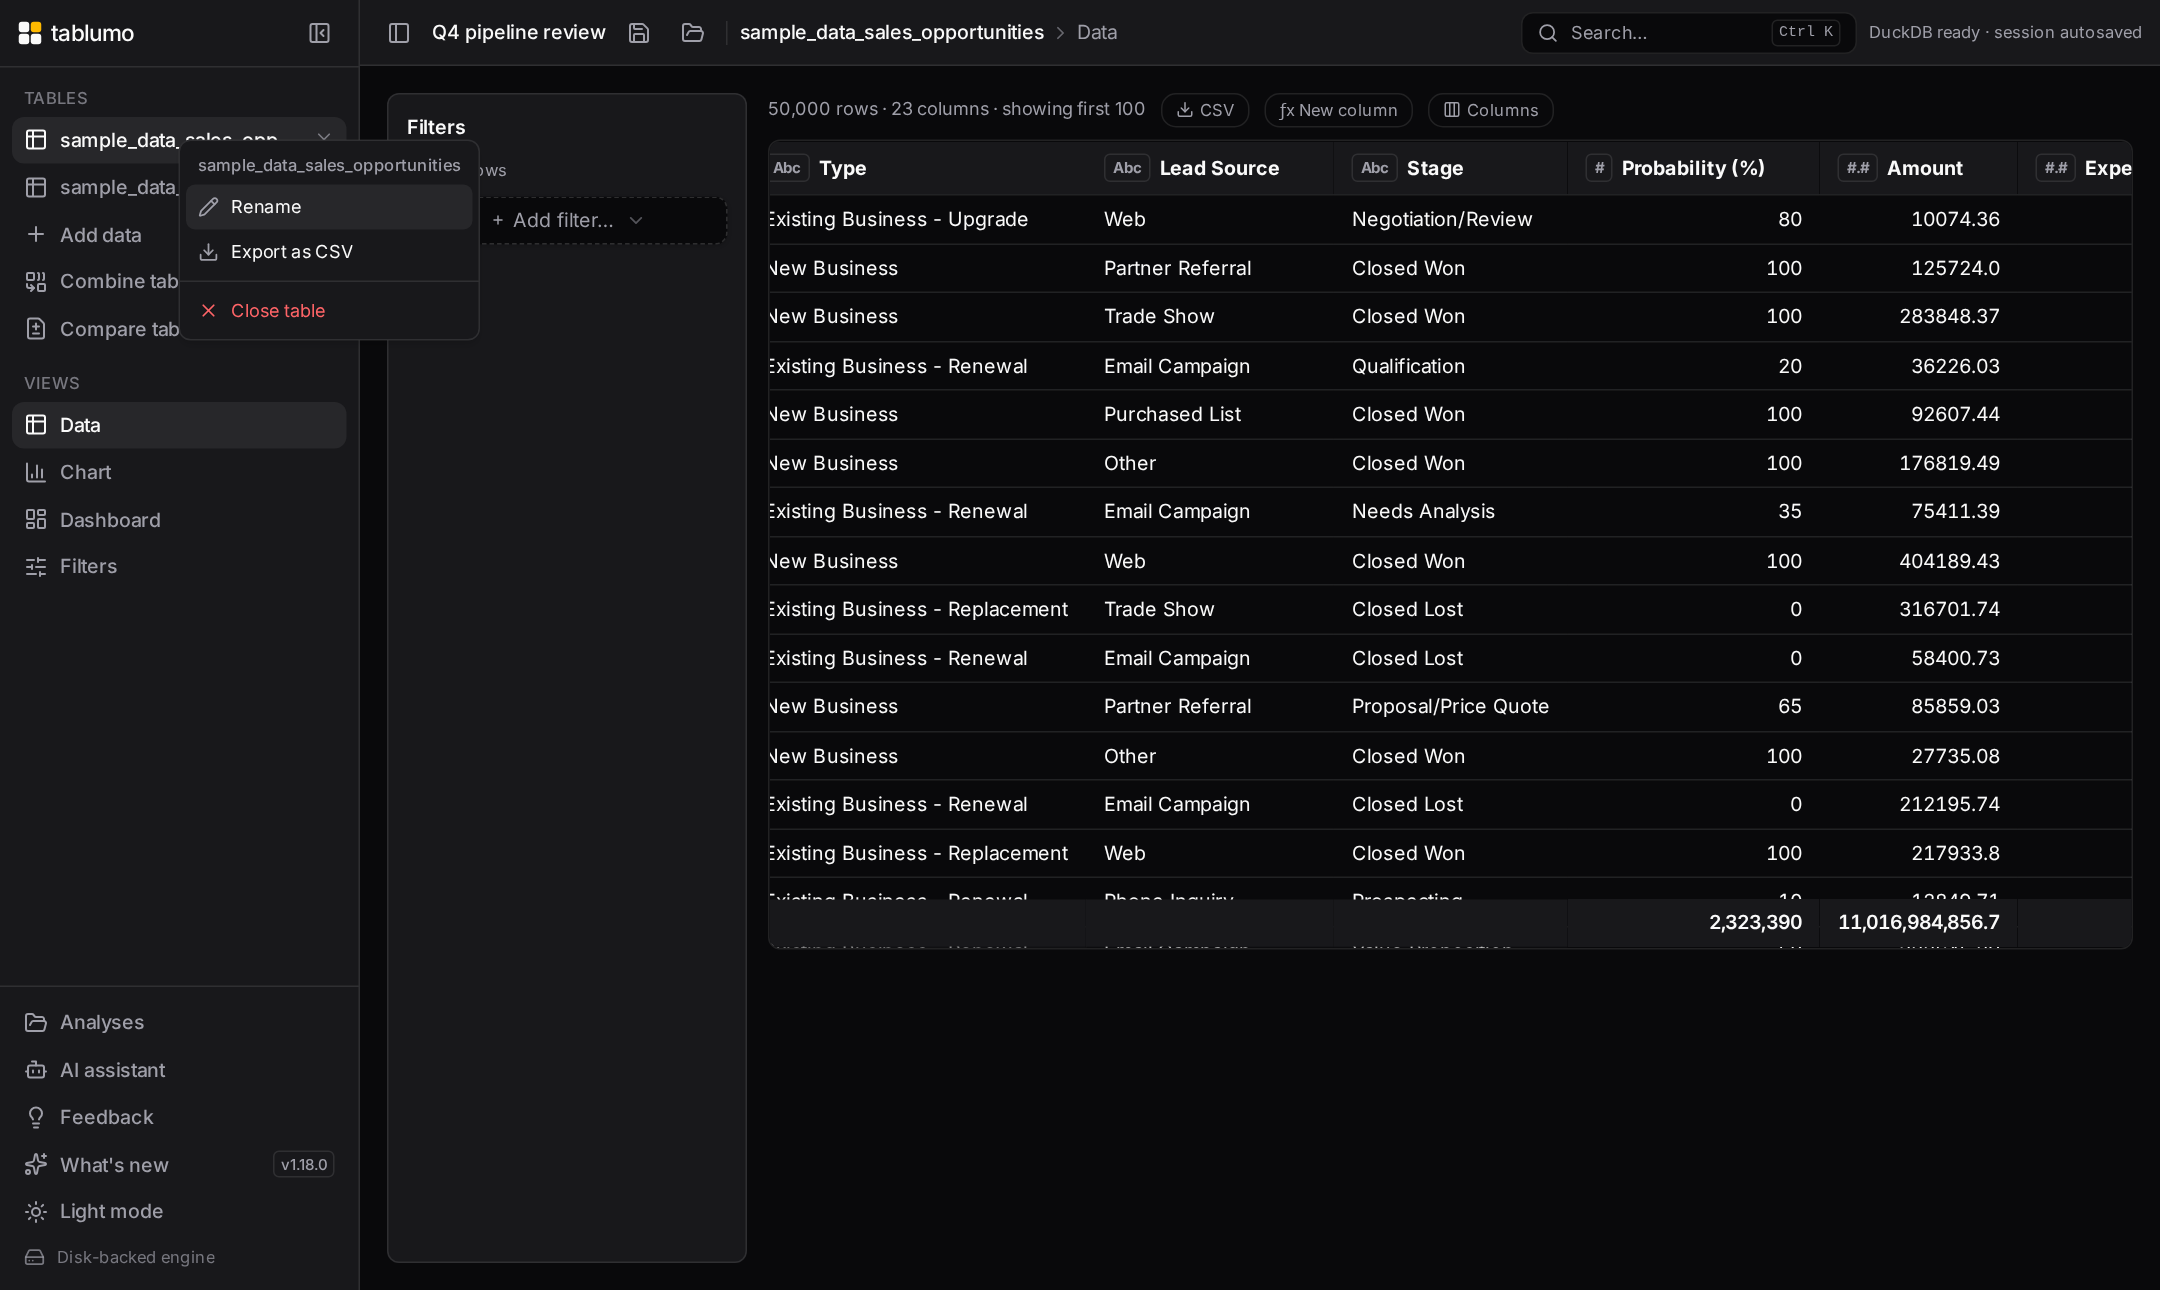
Drag & drop CSV, TSV or Excel files. Delimiters, headers and column types are detected automatically across the whole file; multi-sheet workbooks become one table per sheet; dates keep their time-of-day. In the grid, drag columns into your preferred order and hide the ones you don’t need — and rename any table from the sidebar (right-click or double-click) to the words you actually use.
⊕
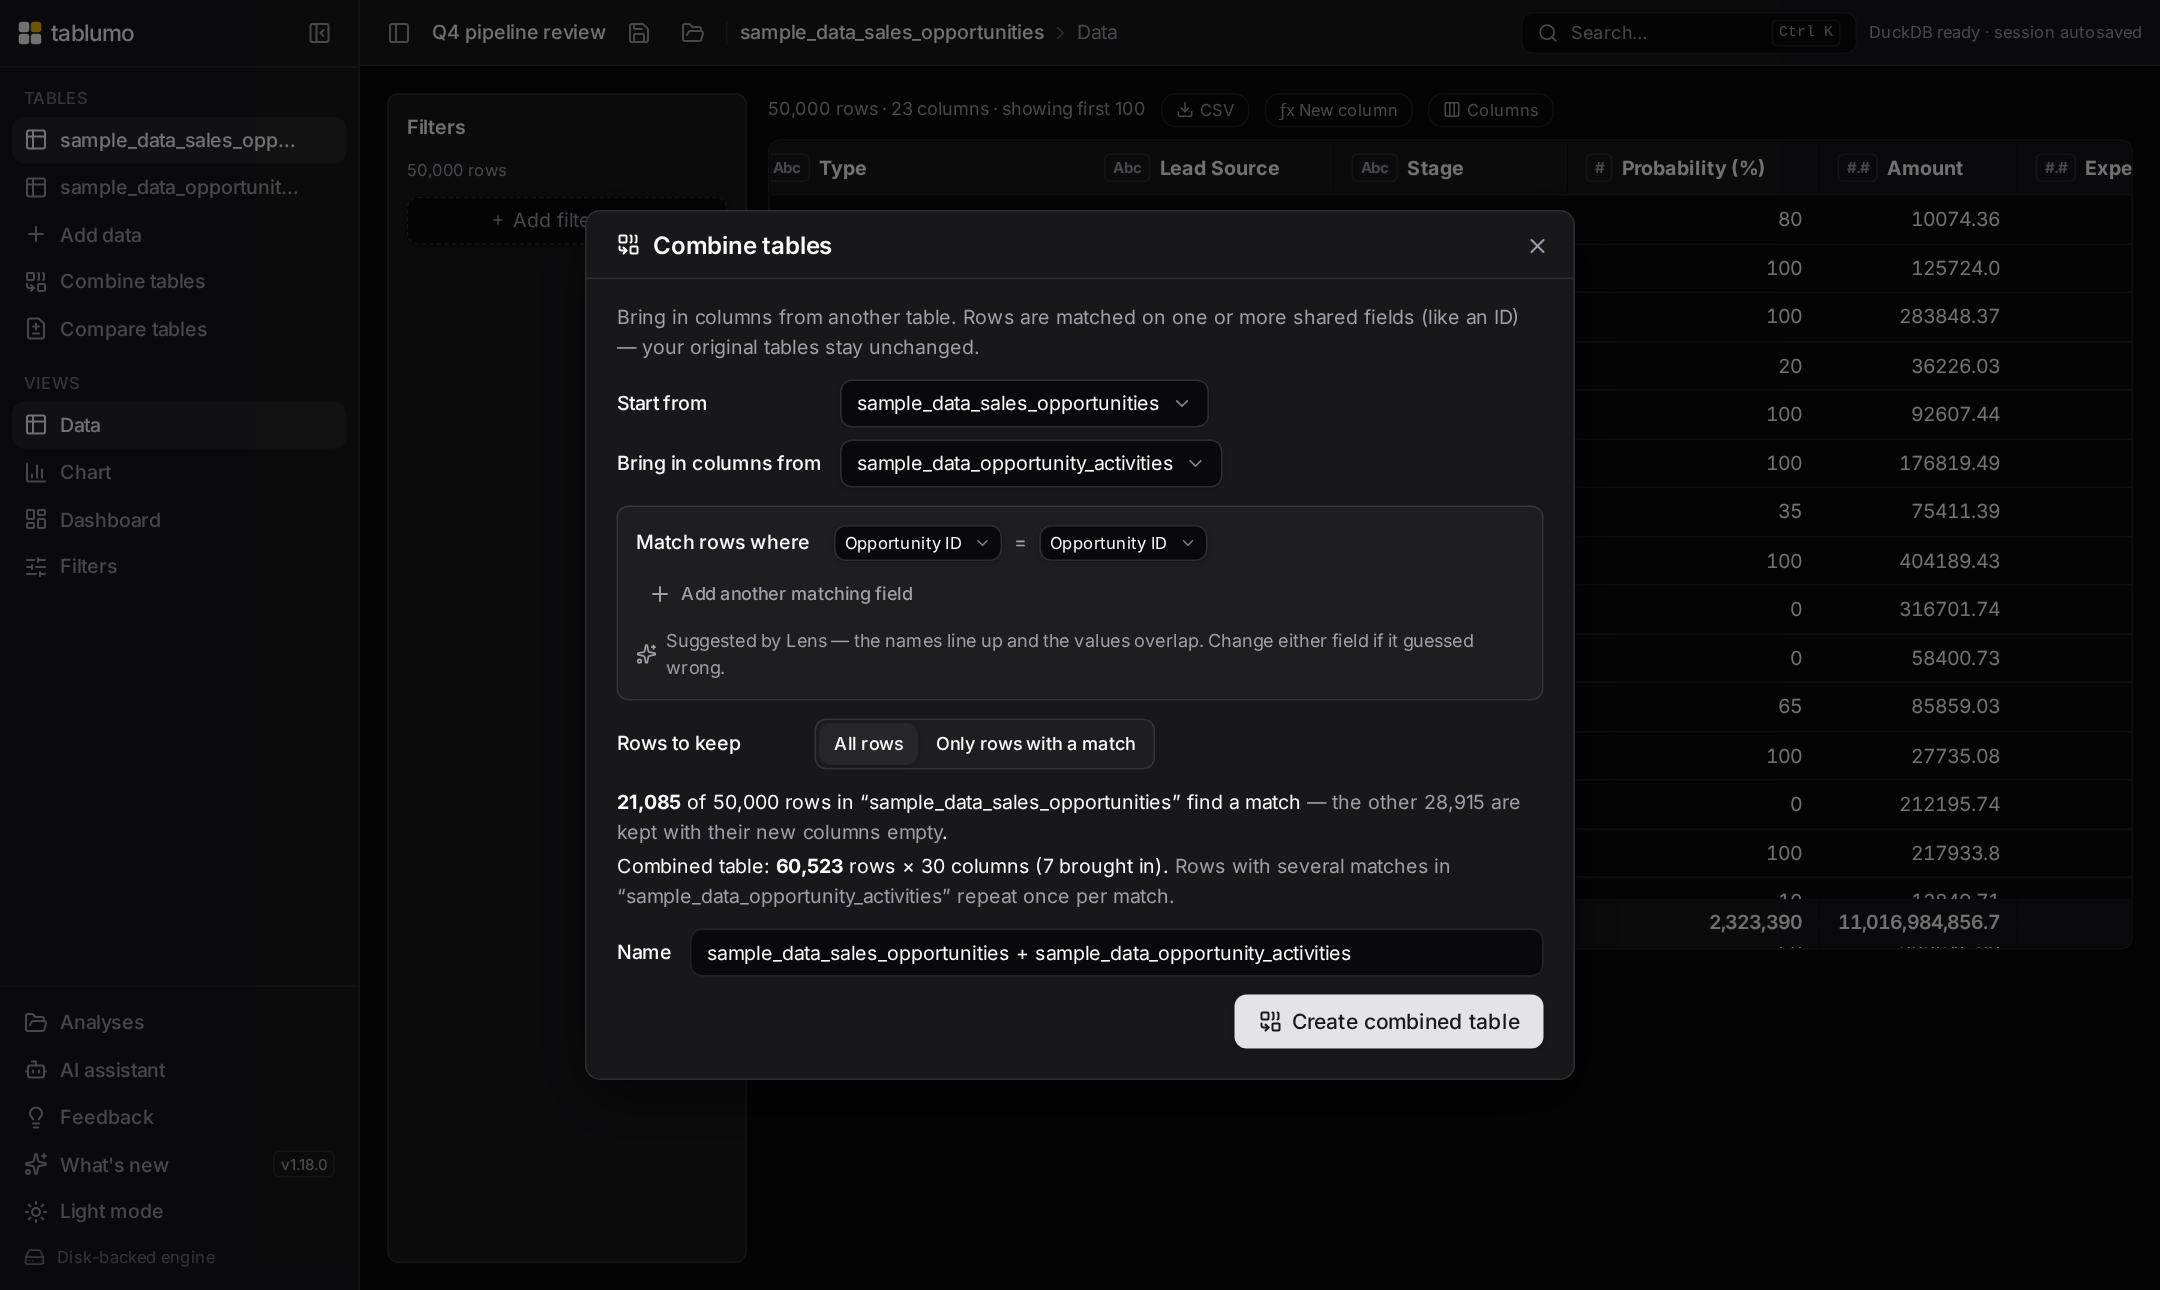
Combine tables
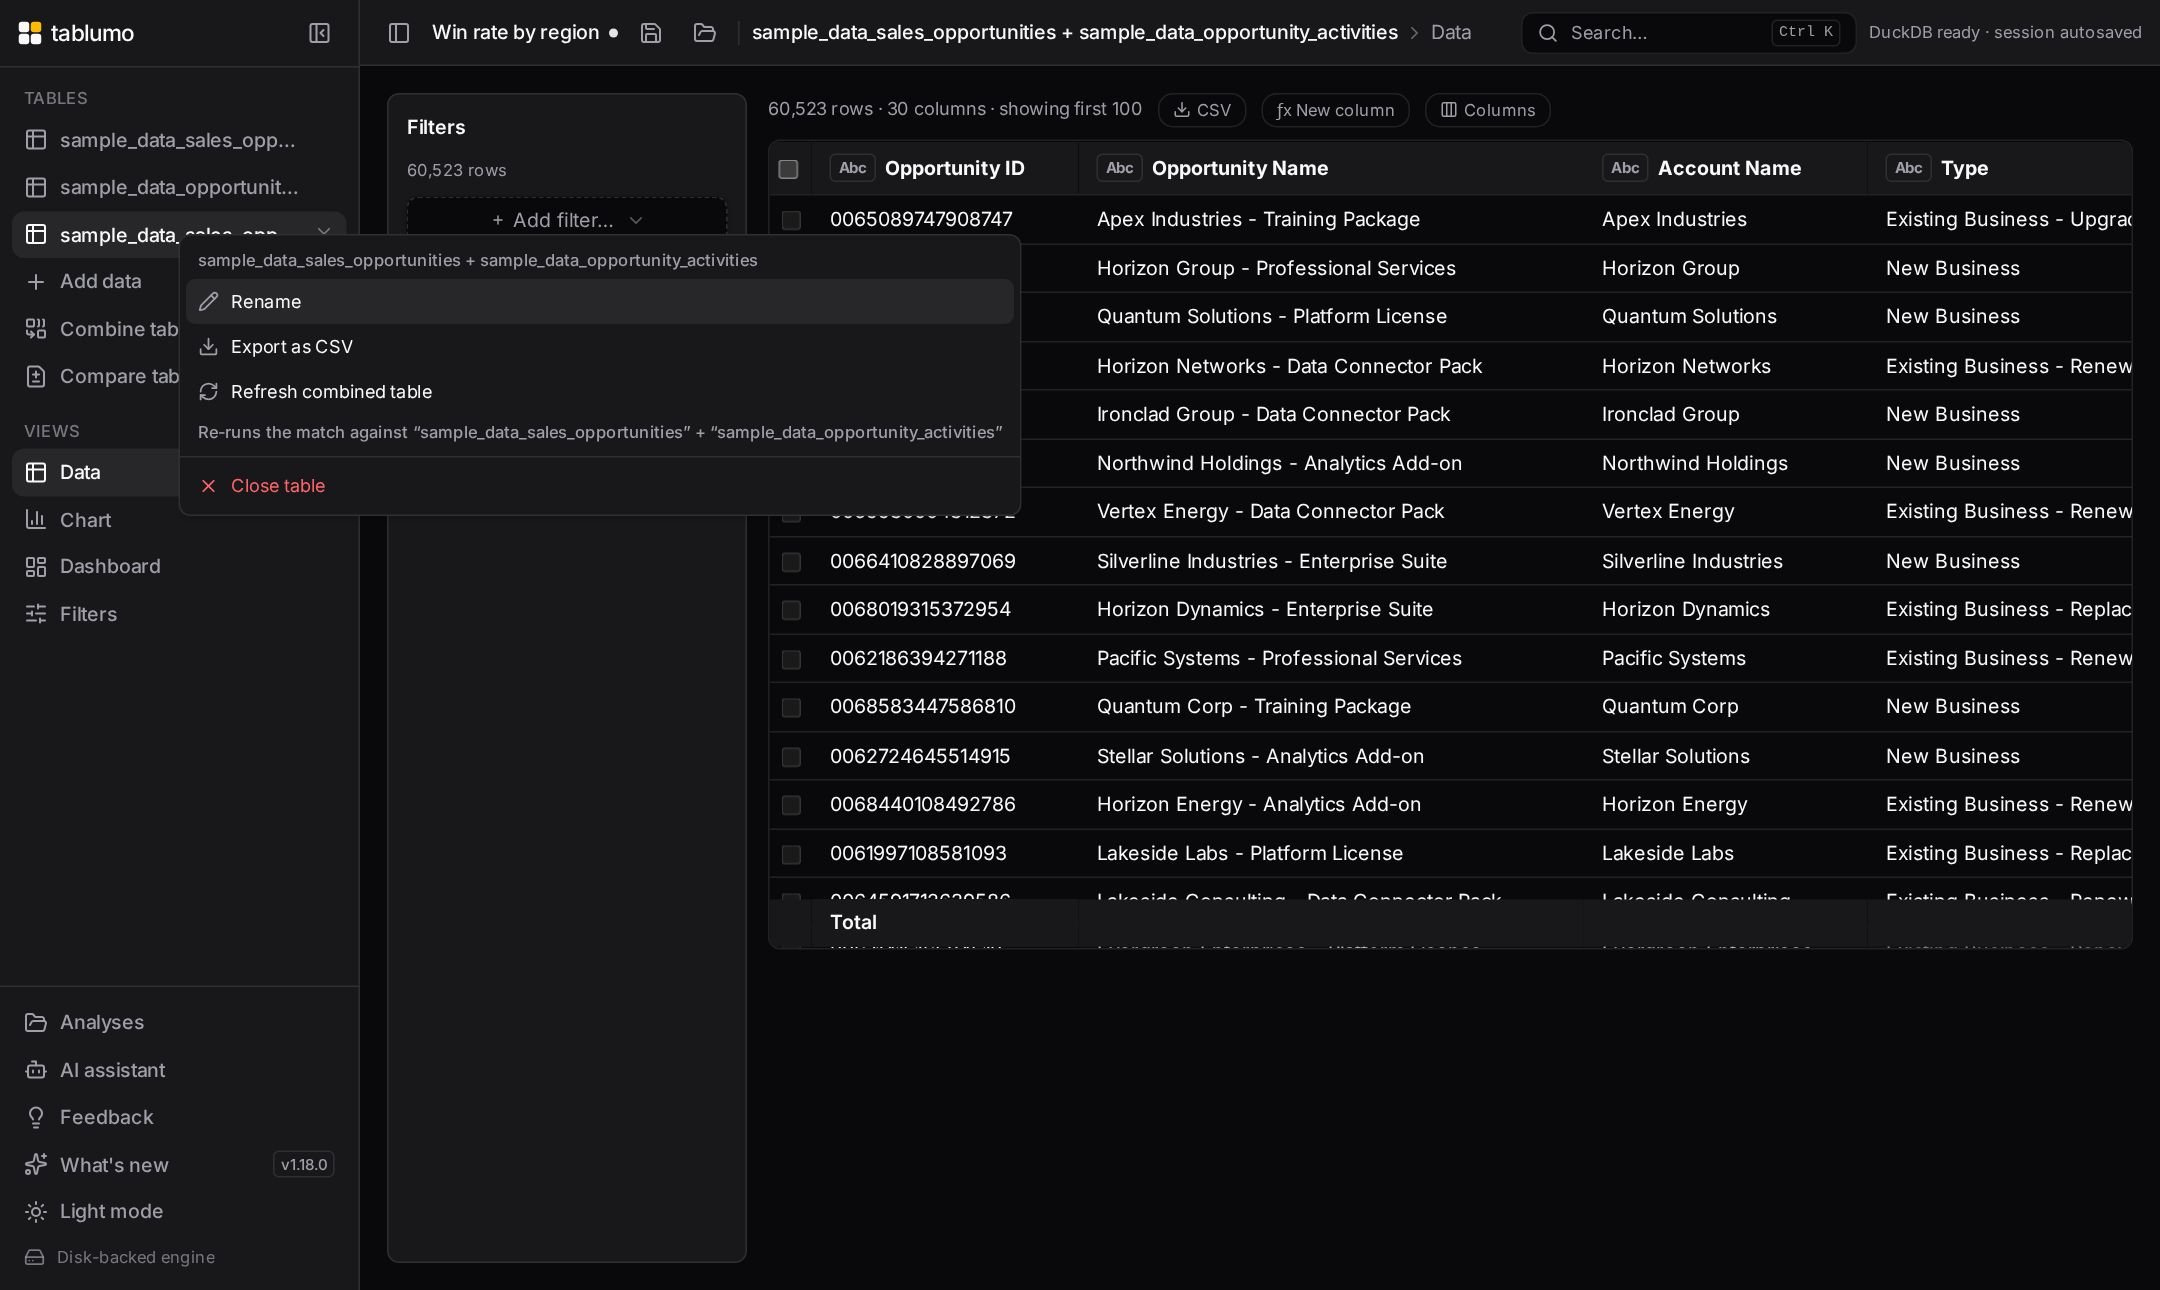
Bring in columns from another file — activities onto their opportunities, targets onto regions. Lens suggests the linking field by comparing names, types and actual values; add more matching fields when one isn't enough, and choose whether rows without a match are kept or left out. Honest match counts before anything is created — and the result is a normal table: chart it, dashboard it, save it. When an original changes later, right-click the combined table and Refresh: the match re-runs in place, with your filters and dashboards staying attached.
⇄
Compare two versions of your data
Yesterday's export vs today's: pick "Compare tables" and Lens suggests the key column, shows honest counts before anything is created — how many rows were added, removed, changed, untouched, and the net delta on every numeric column — then builds a real differences table that reads like a diff: old → new inside the cell, green/red on numeric moves, Added / Removed / Changed badges that filter with one click. Filter it to "Stage changed", chart added-vs-removed by region, export it. Your originals stay untouched. Drop tomorrow's export on top and Lens offers to track it as a dated version — series nest in the sidebar, compare any two in two clicks, and "Versions to keep…" caps a series with honest sizes and an exact preview of what closes.
✨
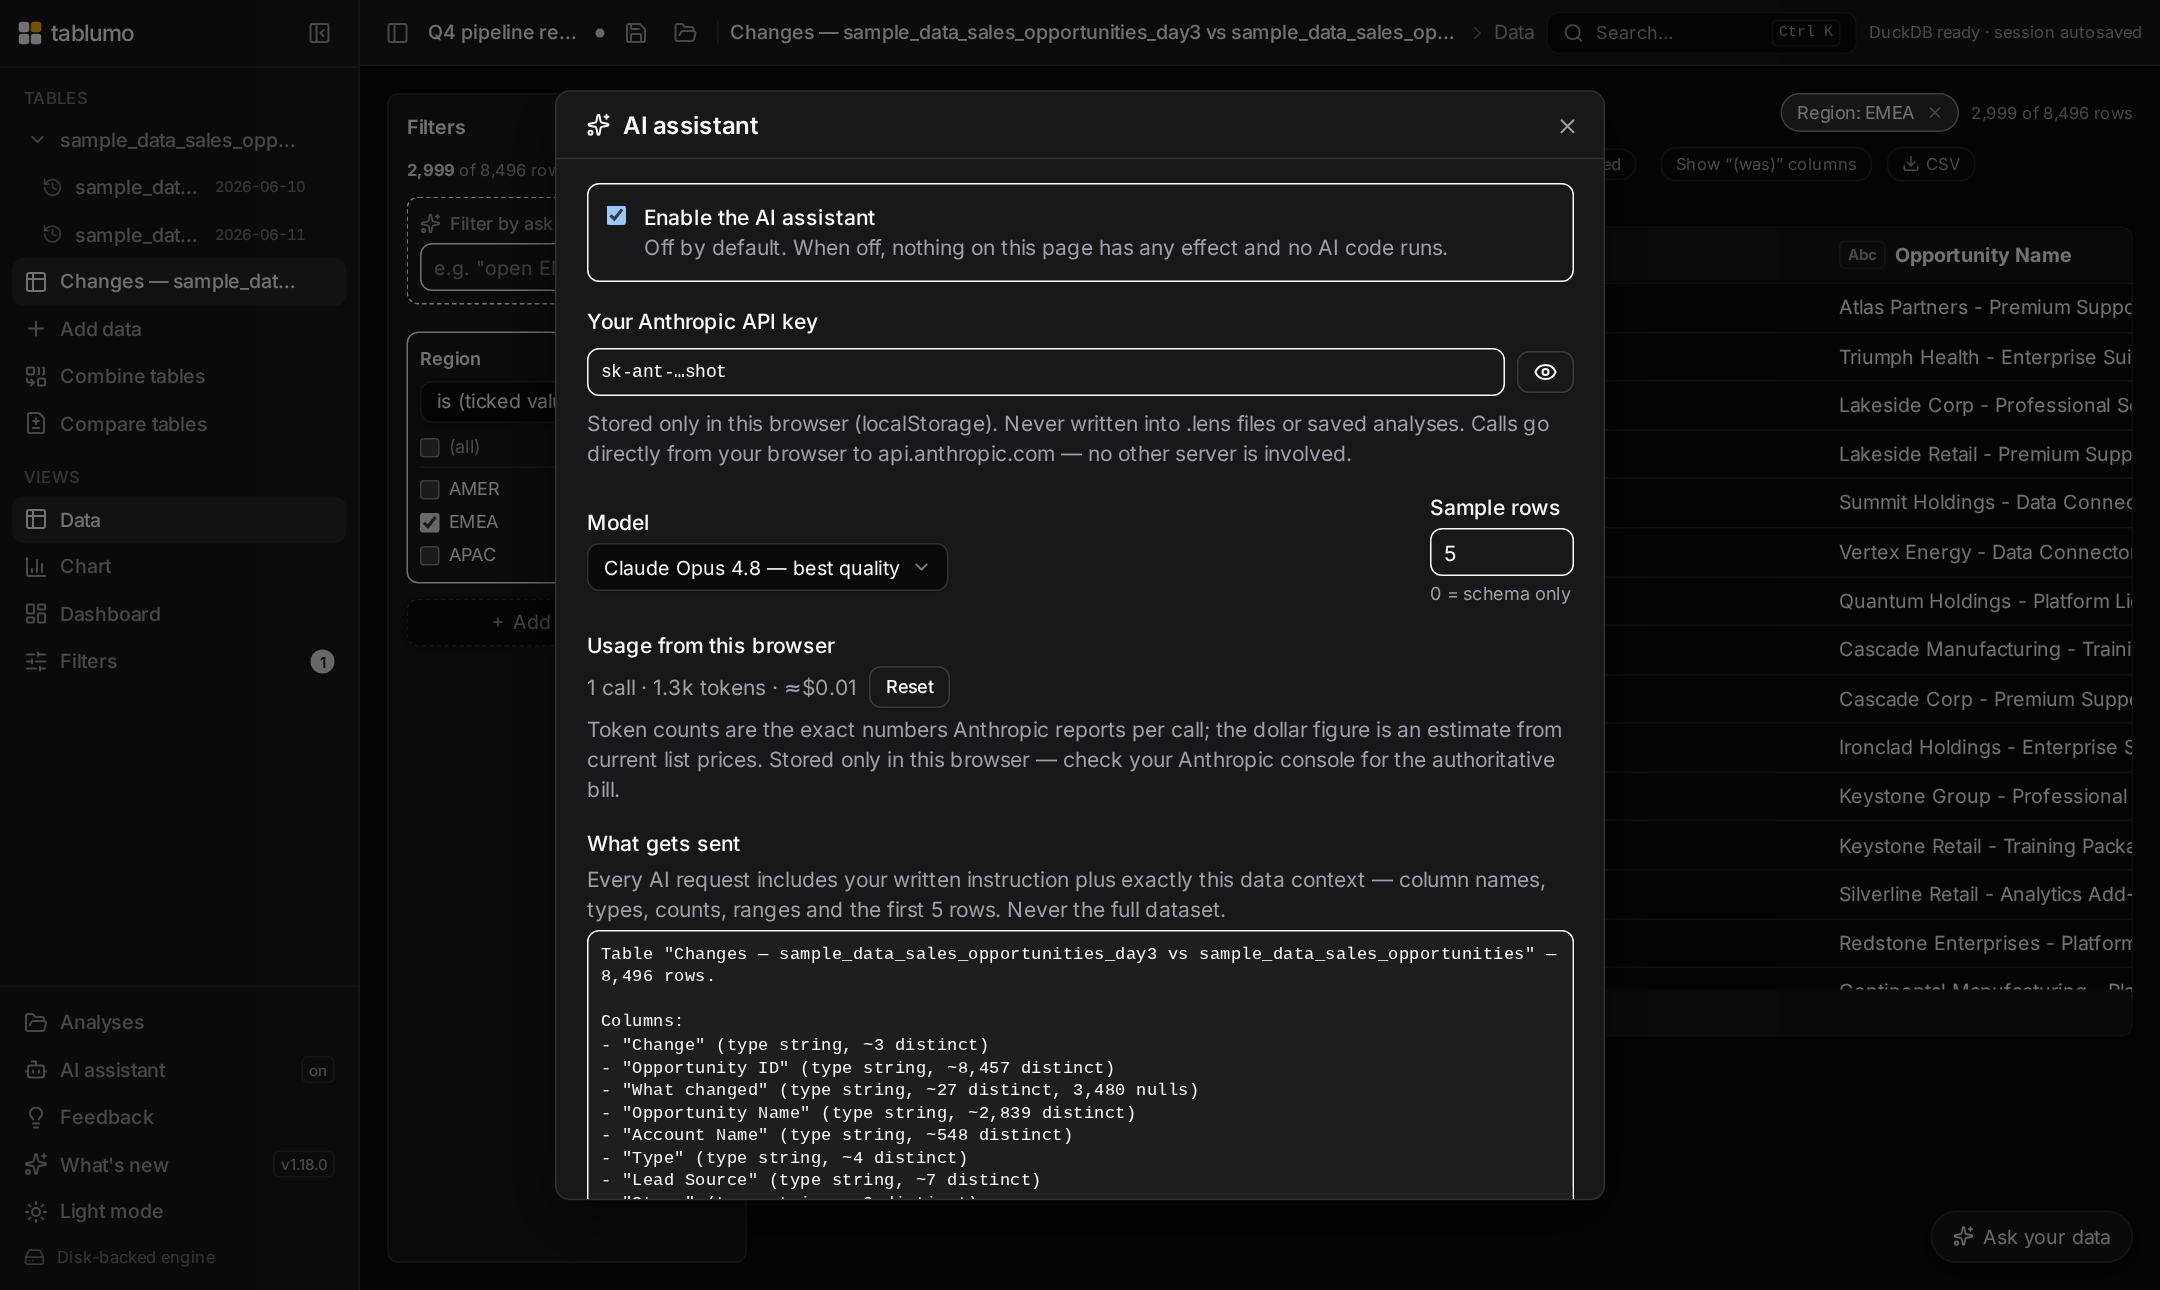
AI assistant — opt-in, transparent, yours
Off by default; when off, nothing AI-related loads or runs. Turn it on with your own Anthropic API key (stored only in your browser, calls go directly to Anthropic — no middleman server) and filter by asking: "open EMEA deals above 100k" becomes ordinary, validated filter chips you can see and remove one by one. Or have it build a whole dashboard: describe the board in plain words — or answer up to five multiple-choice questions it writes about your actual data — and a validated plan becomes real, editable pages, with one-click undo. The settings dialog shows the exact schema-and-sample payload any request sends — you choose how many sample rows, down to zero. Never your full dataset.
📊
Charts with smart defaults
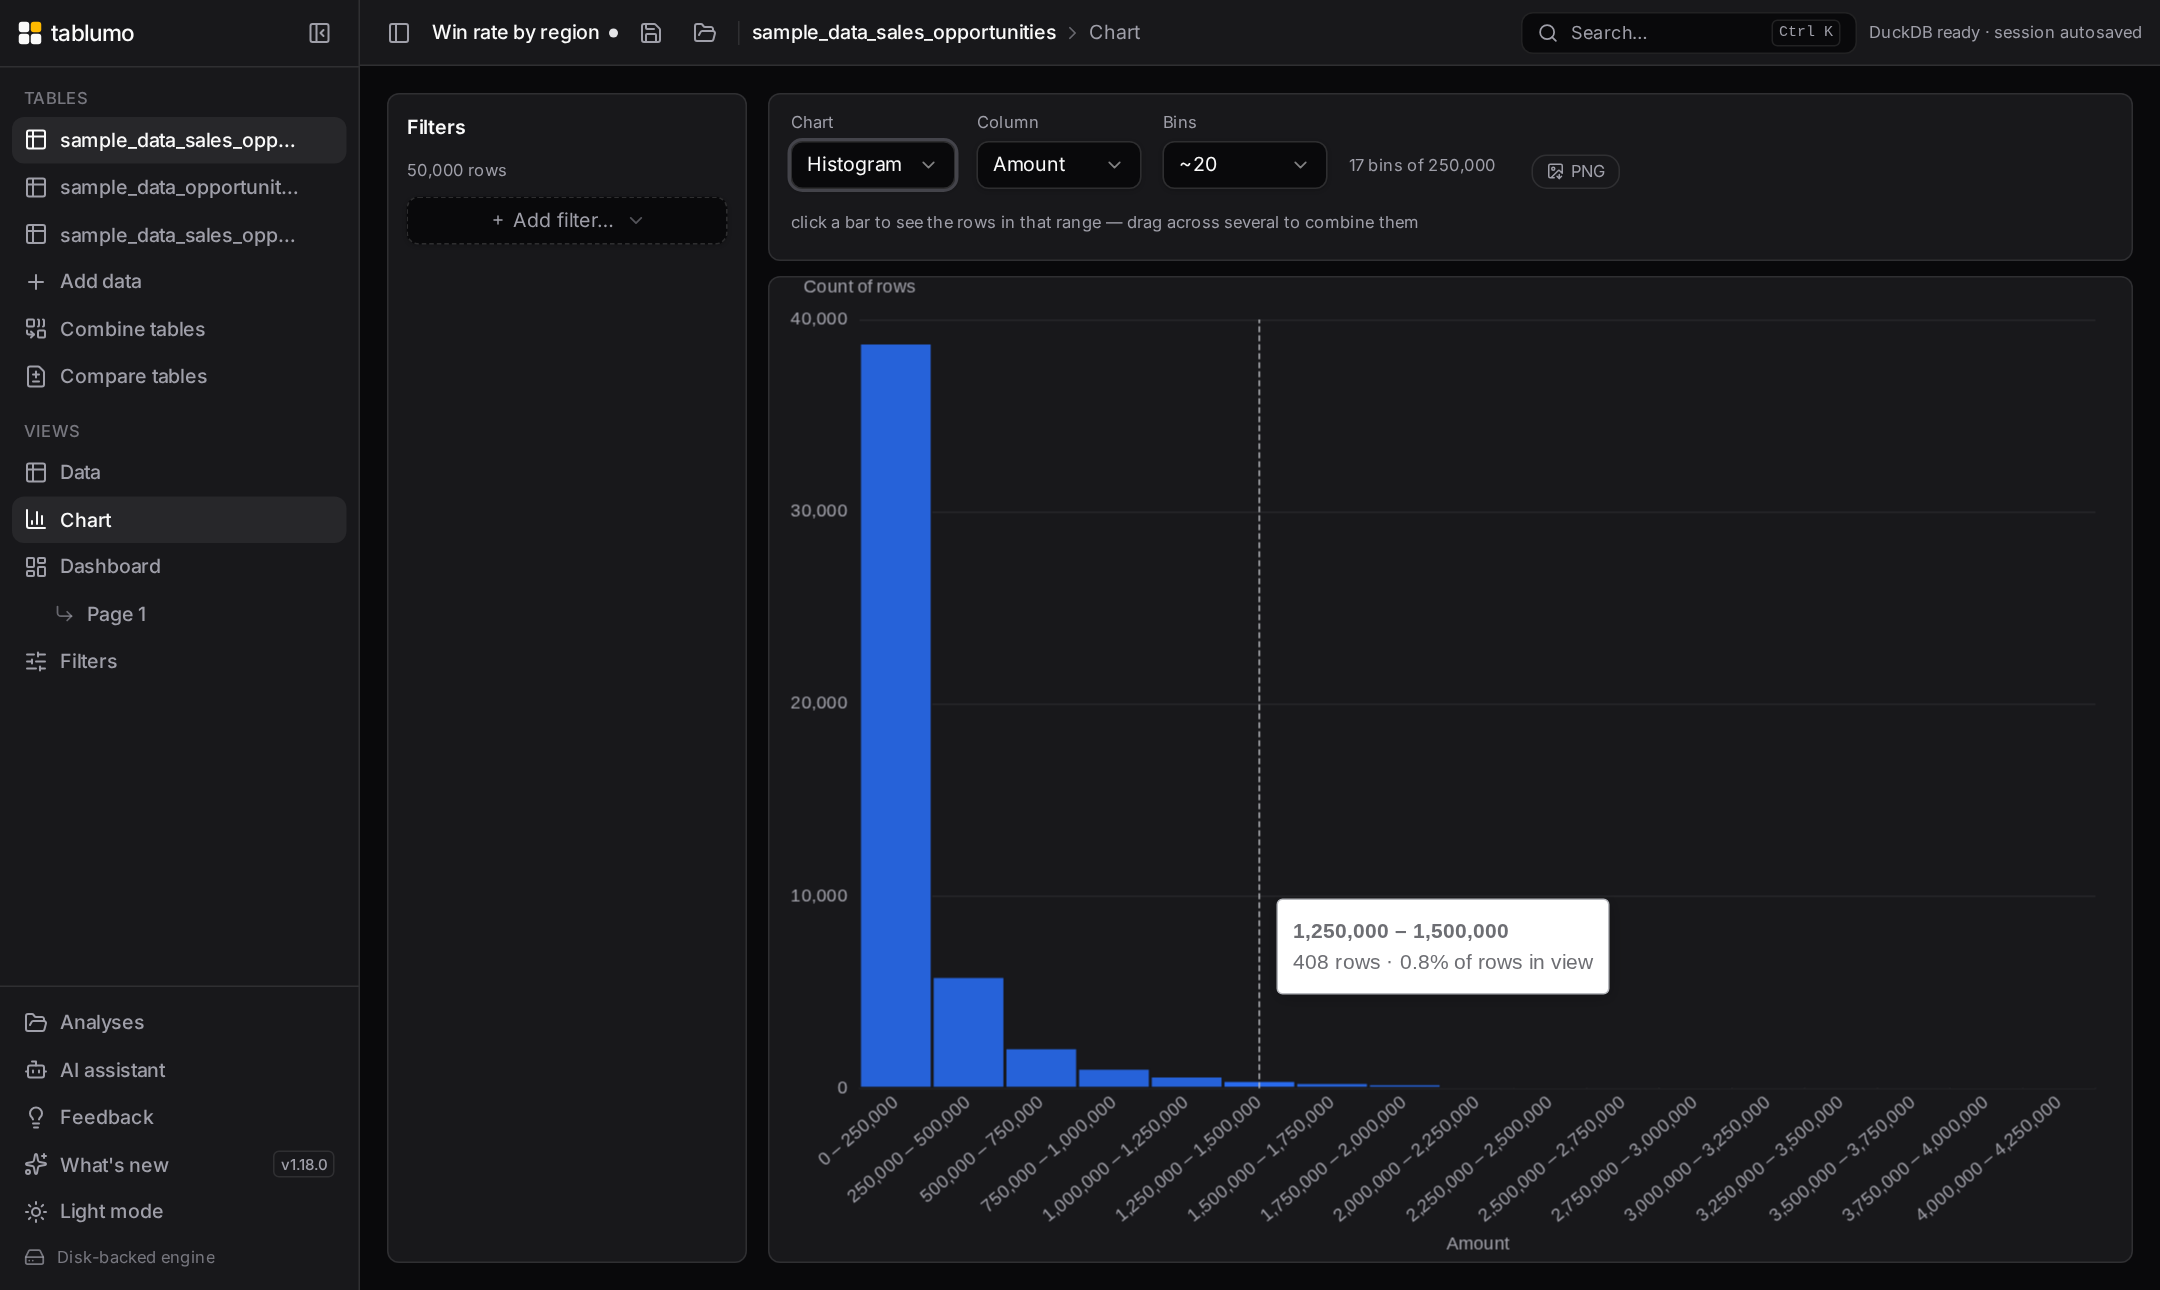
Bar, line, area, pie, scatter, histogram, heatmap and box plot. New charts open already meaningful — Lens picks a readable grouping and a summable measure for you. Stack or split by a second column, roll dates up by year, half-year, quarter, month, week or day — and overlay dashed Average, Median, Min or Max reference lines with one click, in the Chart view and on dashboard tiles, with tooltips reading the distance to each line ("vs Avg 1.2M: +12%"). Type a goal and it draws as a solid target line — the axis stretches so it never hides off-chart. Histograms bin any numeric column with clean round edges (on dashboards too, cross-filtering by the real ranges); heatmaps put two categories on a color matrix where darker means more; box plots compare how a number spreads across categories — quartiles, median and true min/max, computed over all your rows, never a sample. Currency columns keep their symbol on axes, tooltips and KPI tiles — €1.2M reads as money, not a bare number.
📋
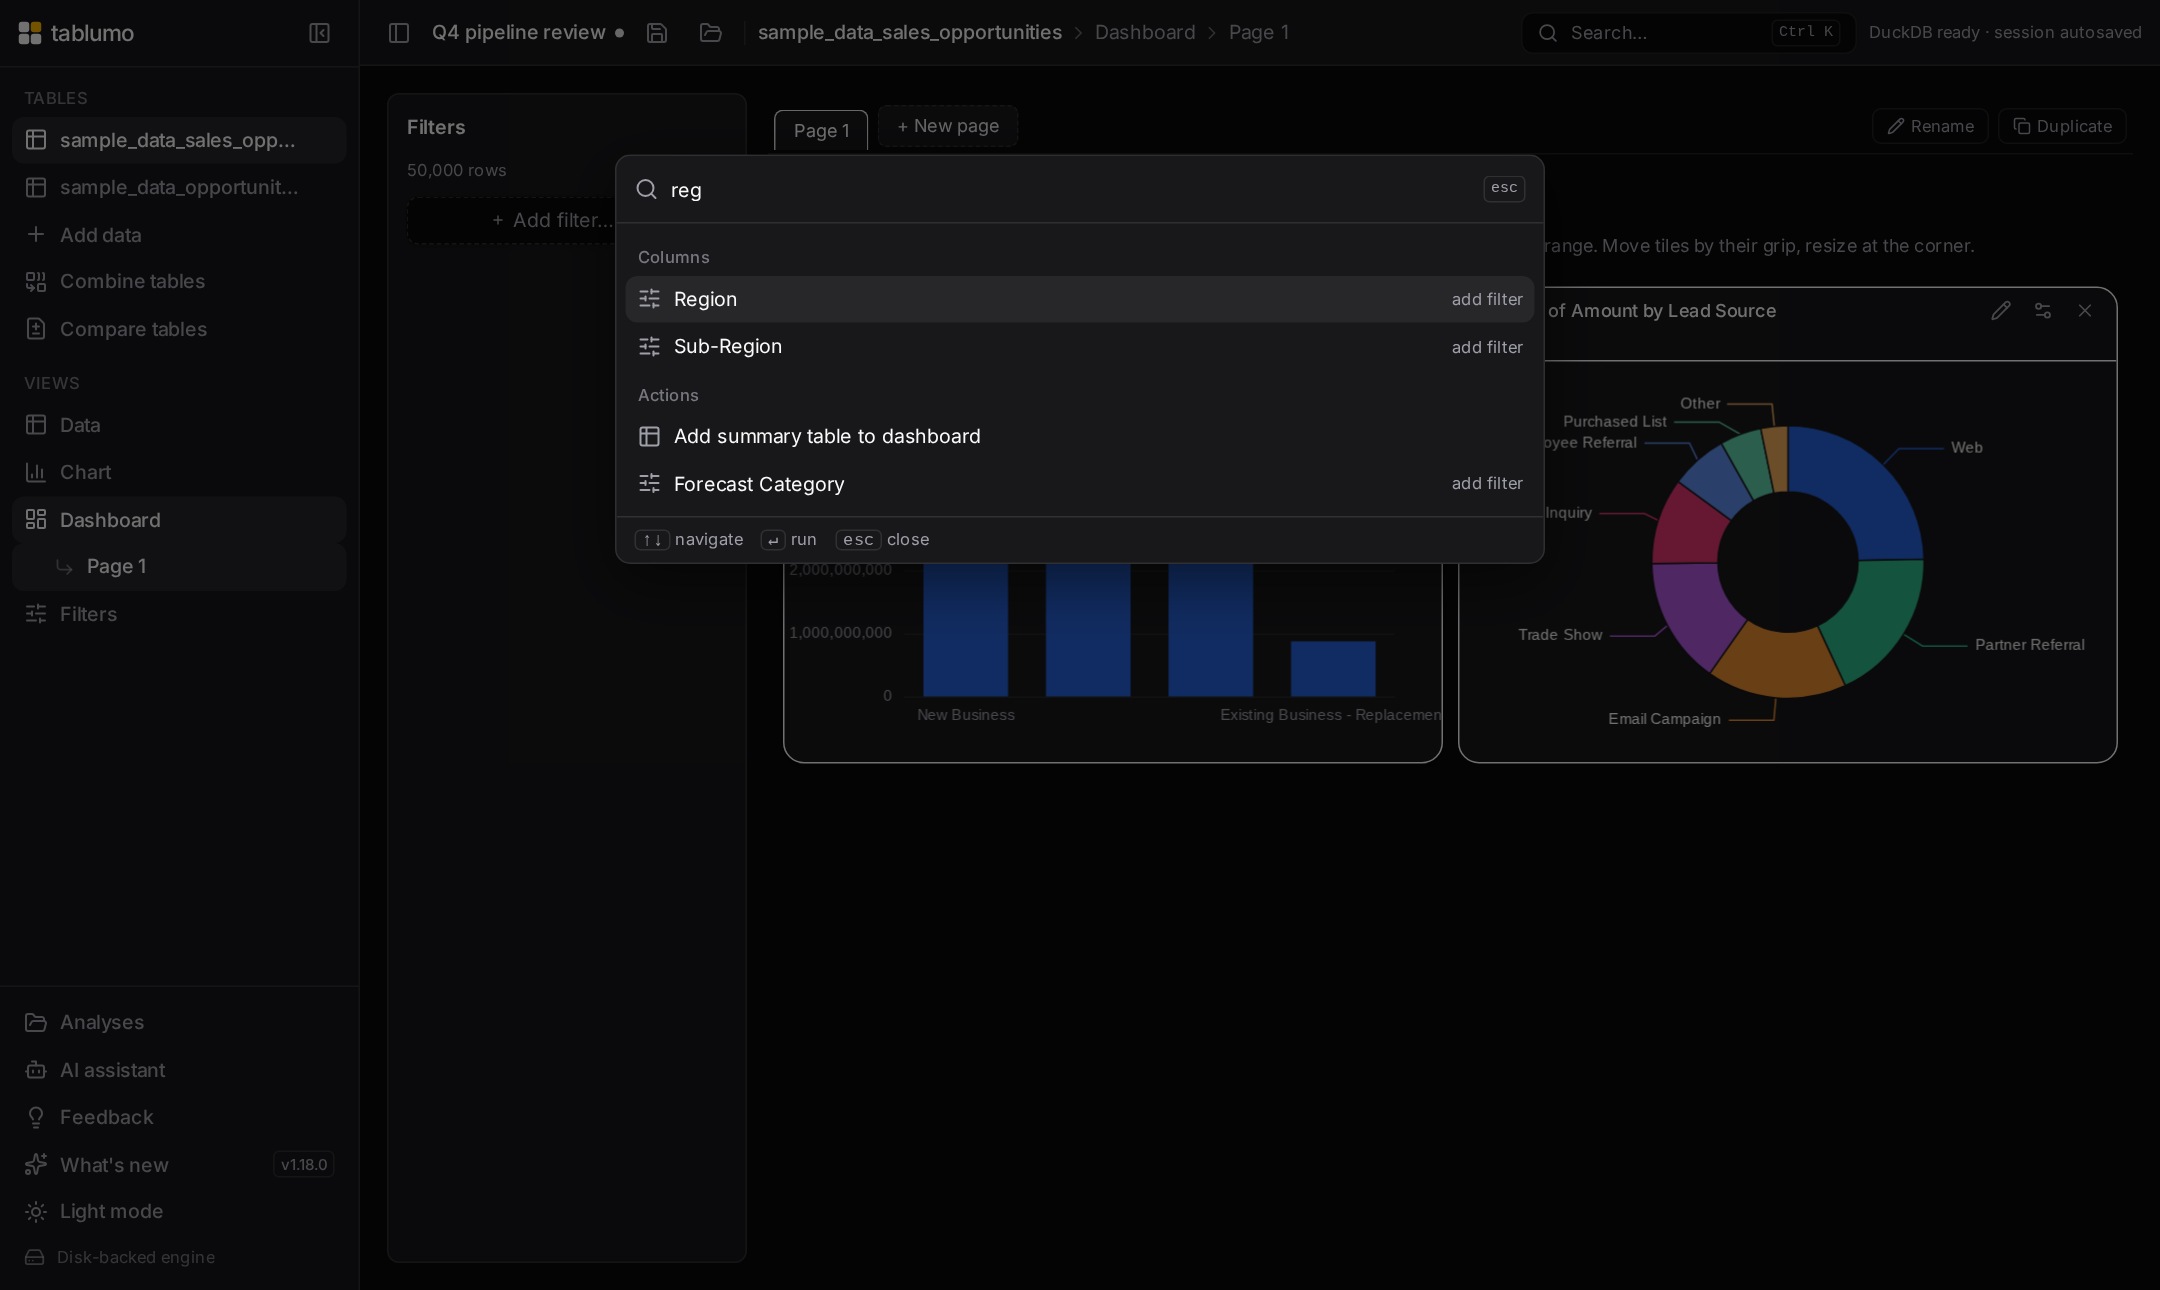
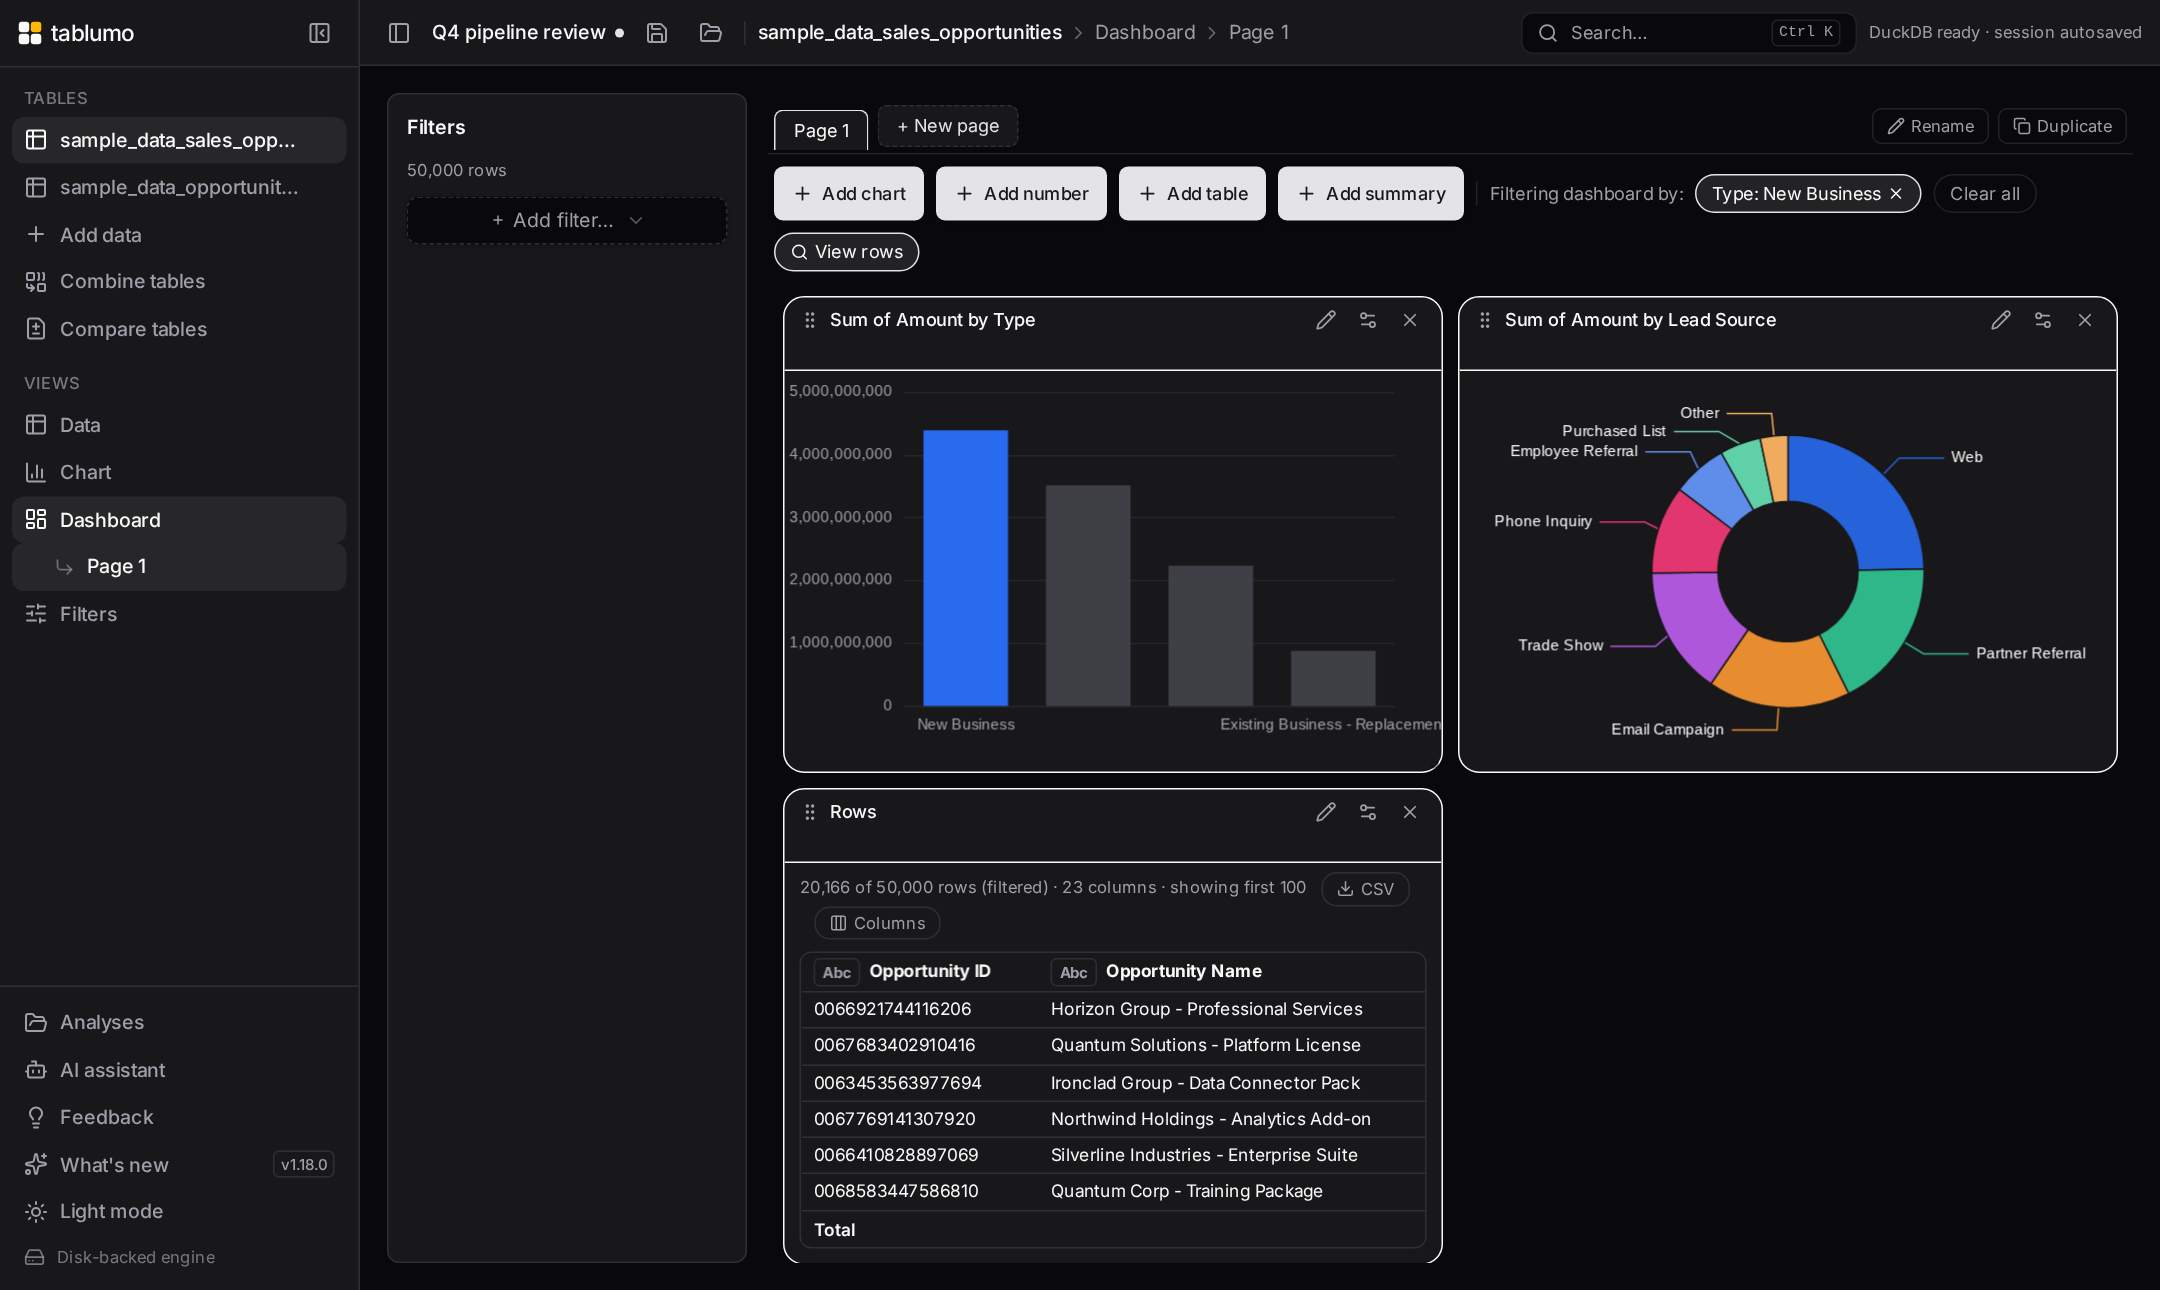
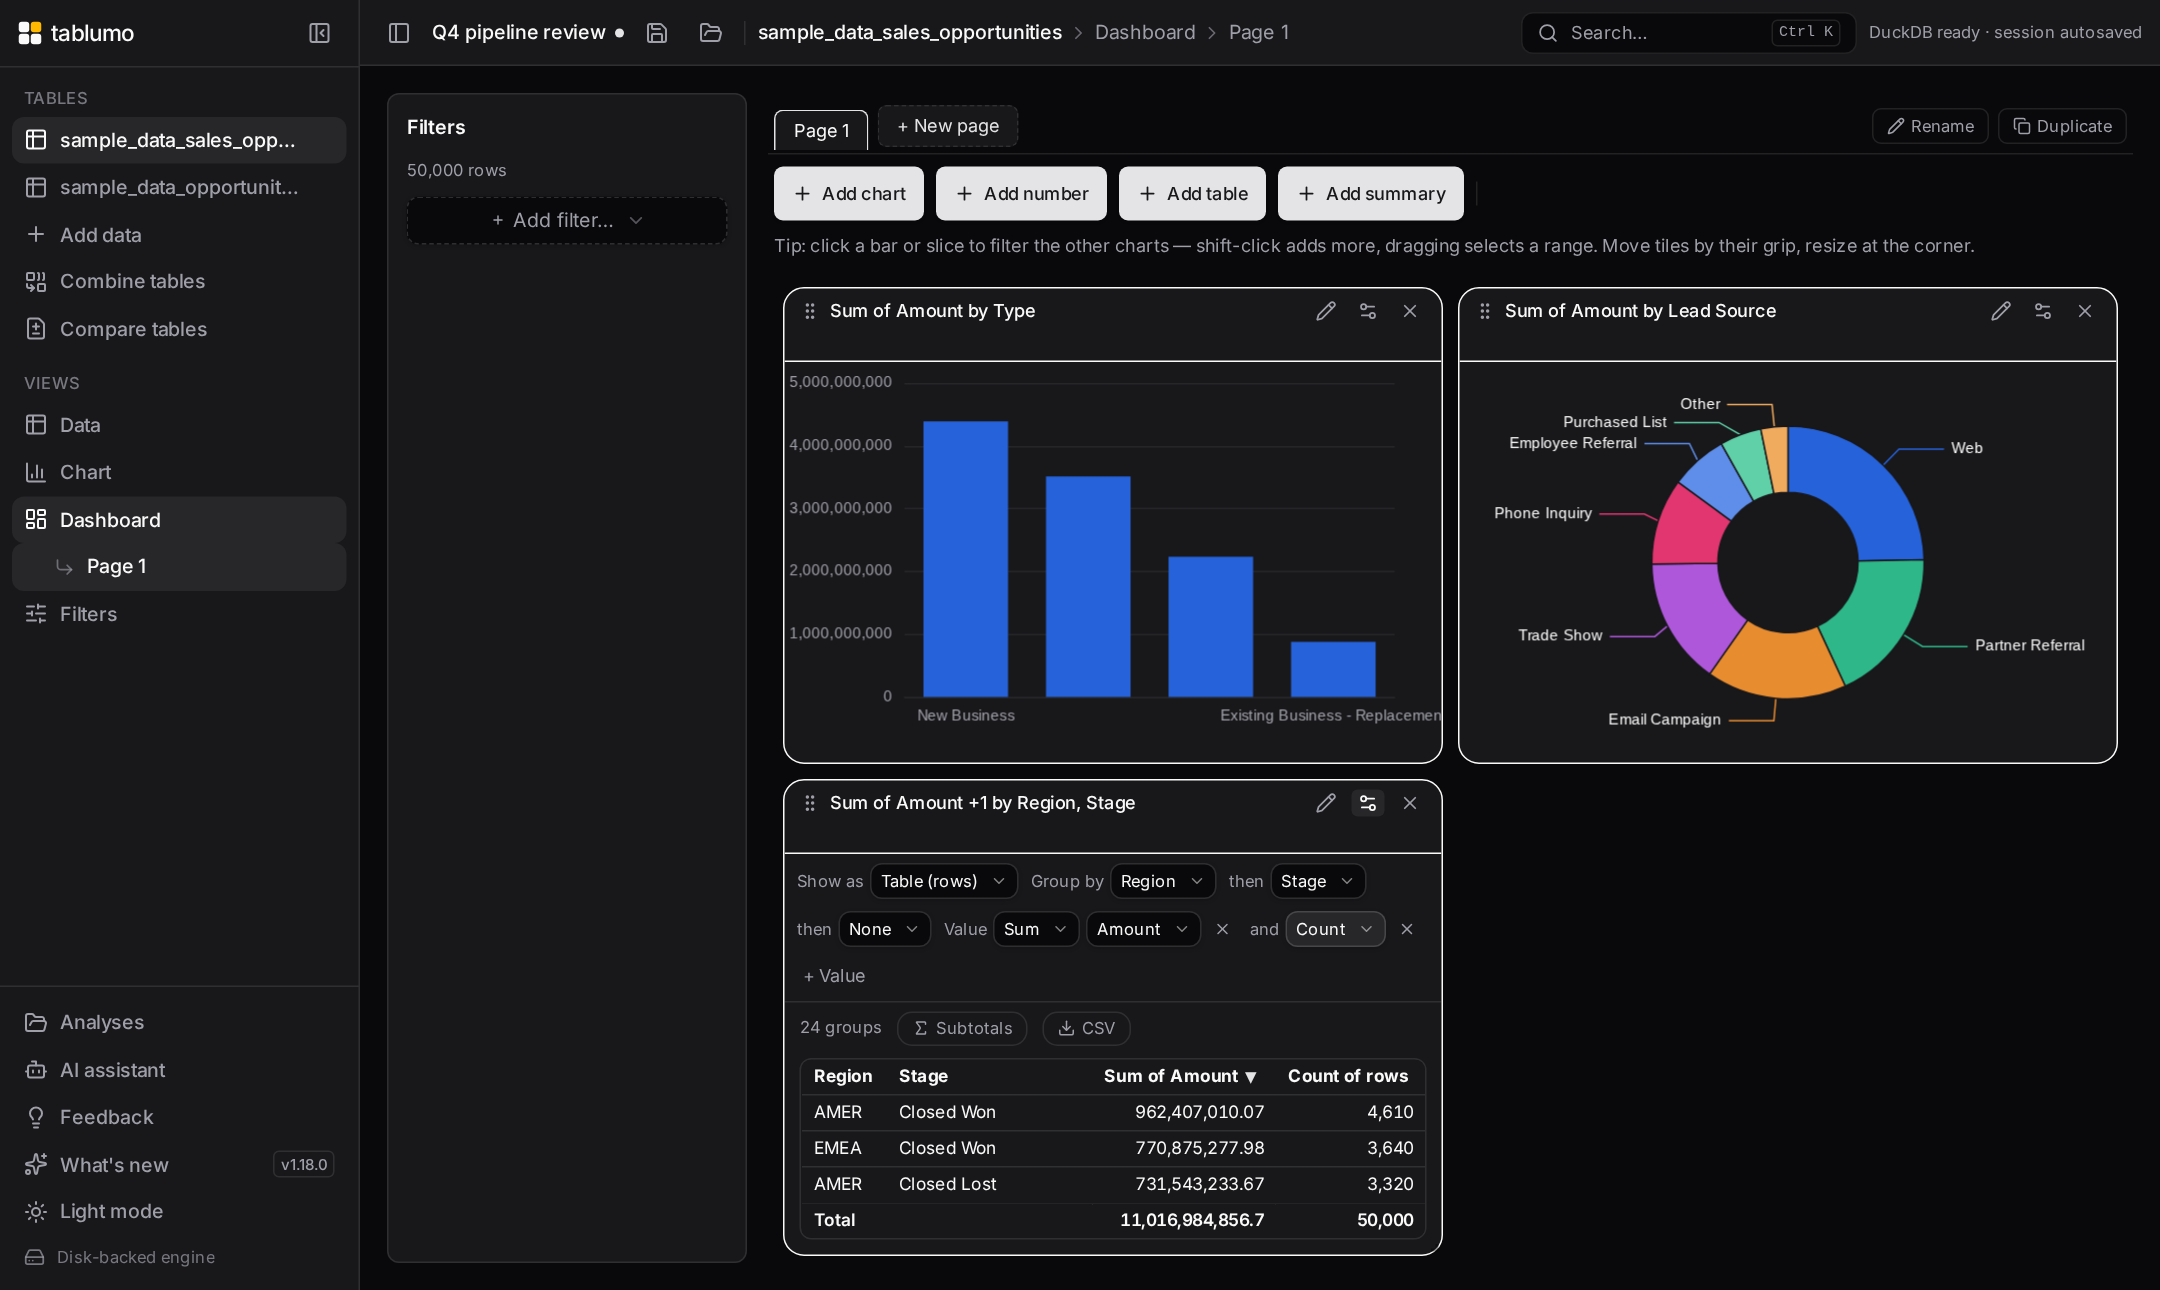
Cross-filtering dashboards
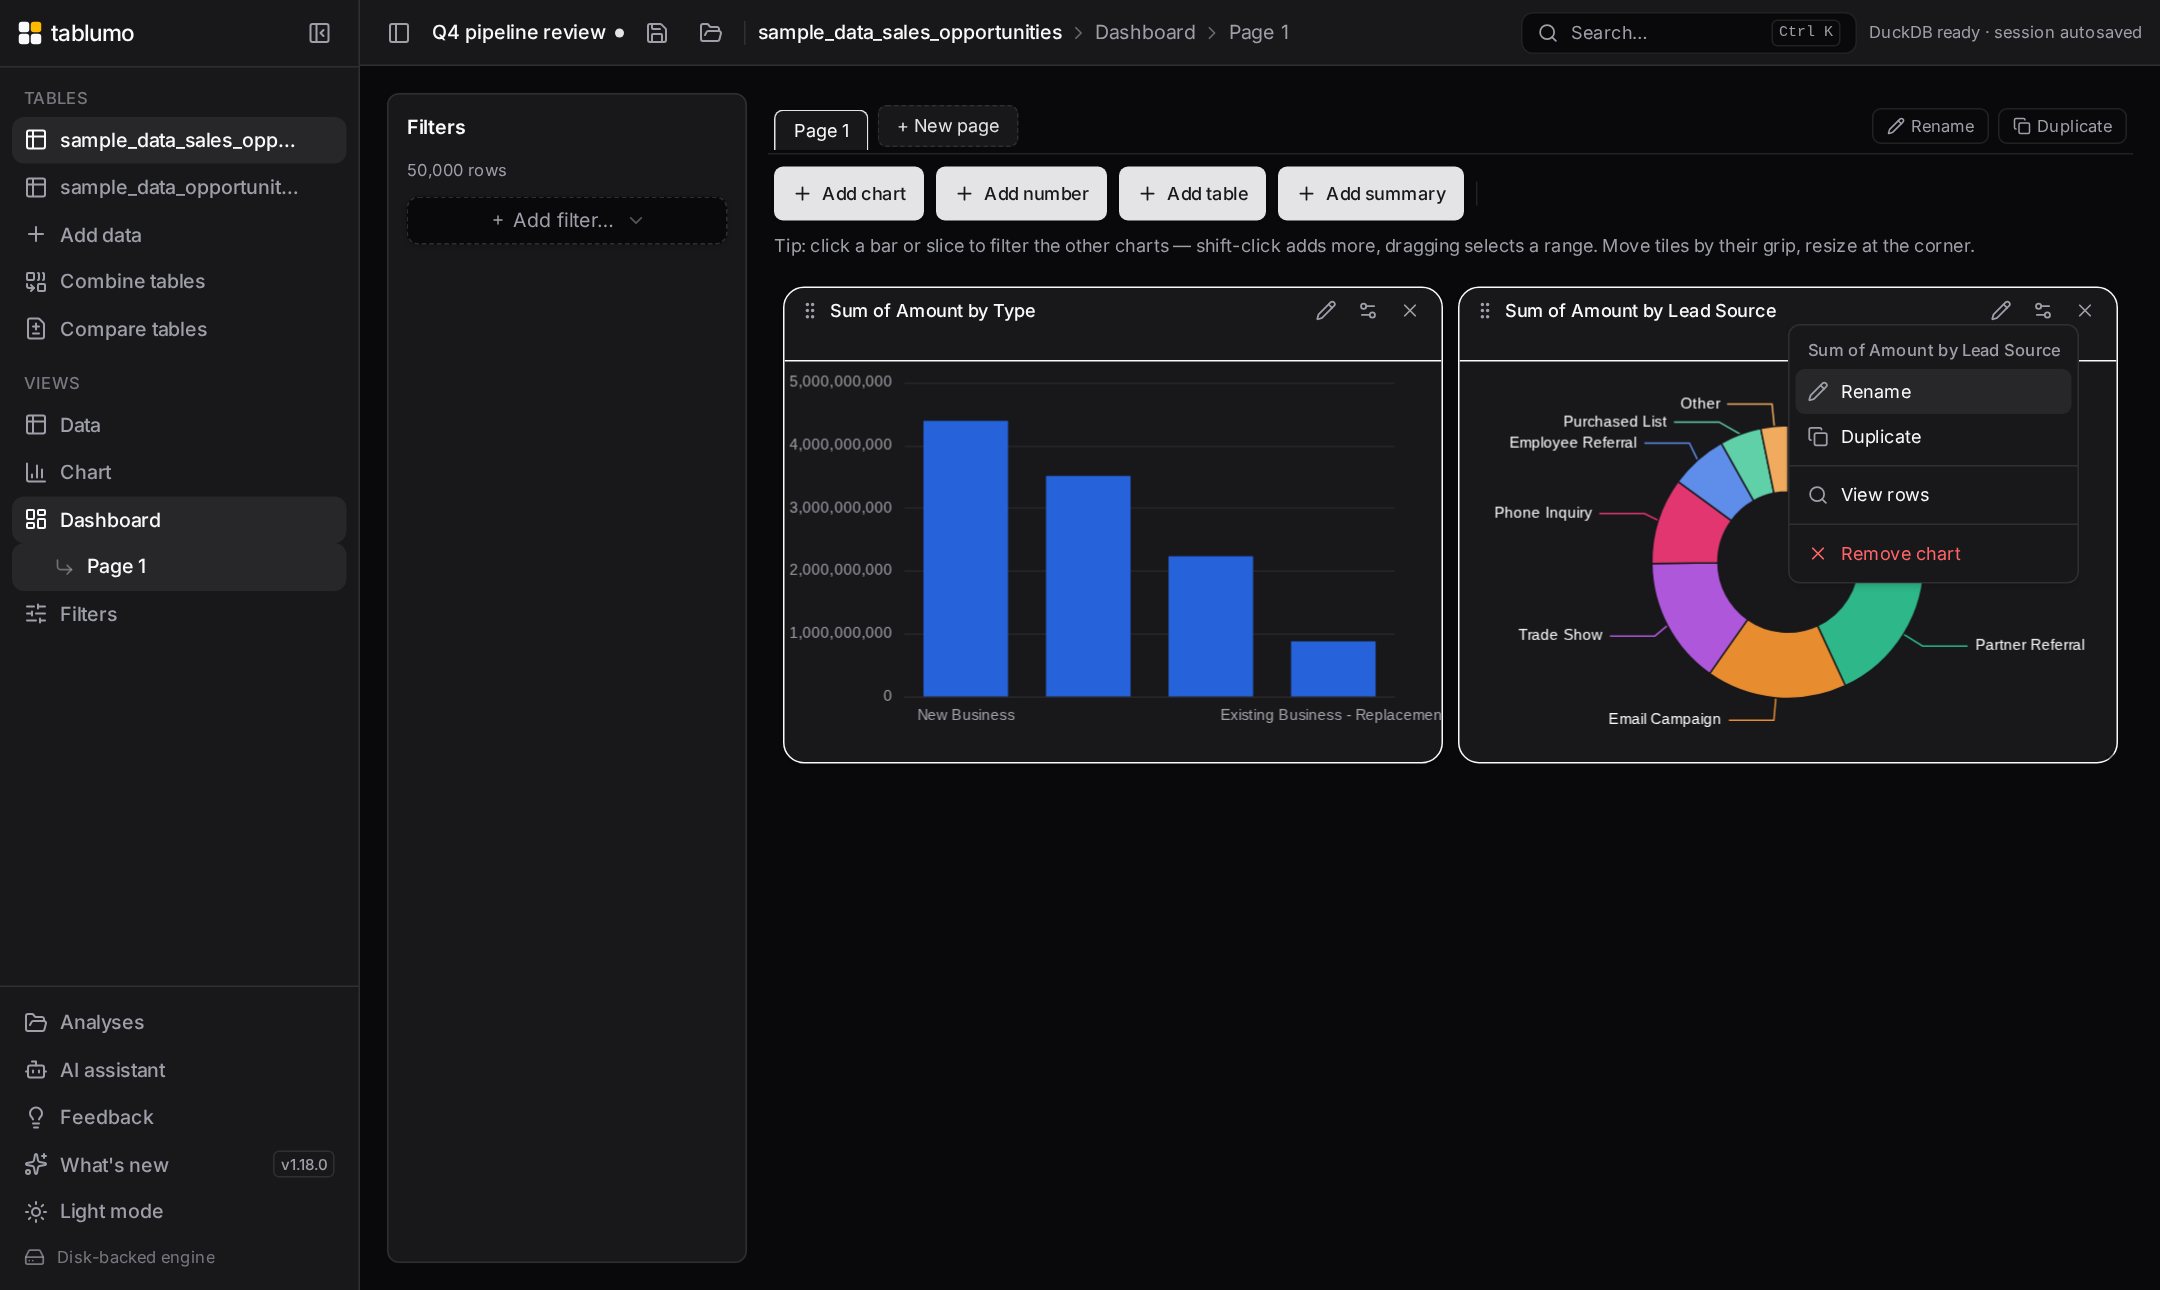
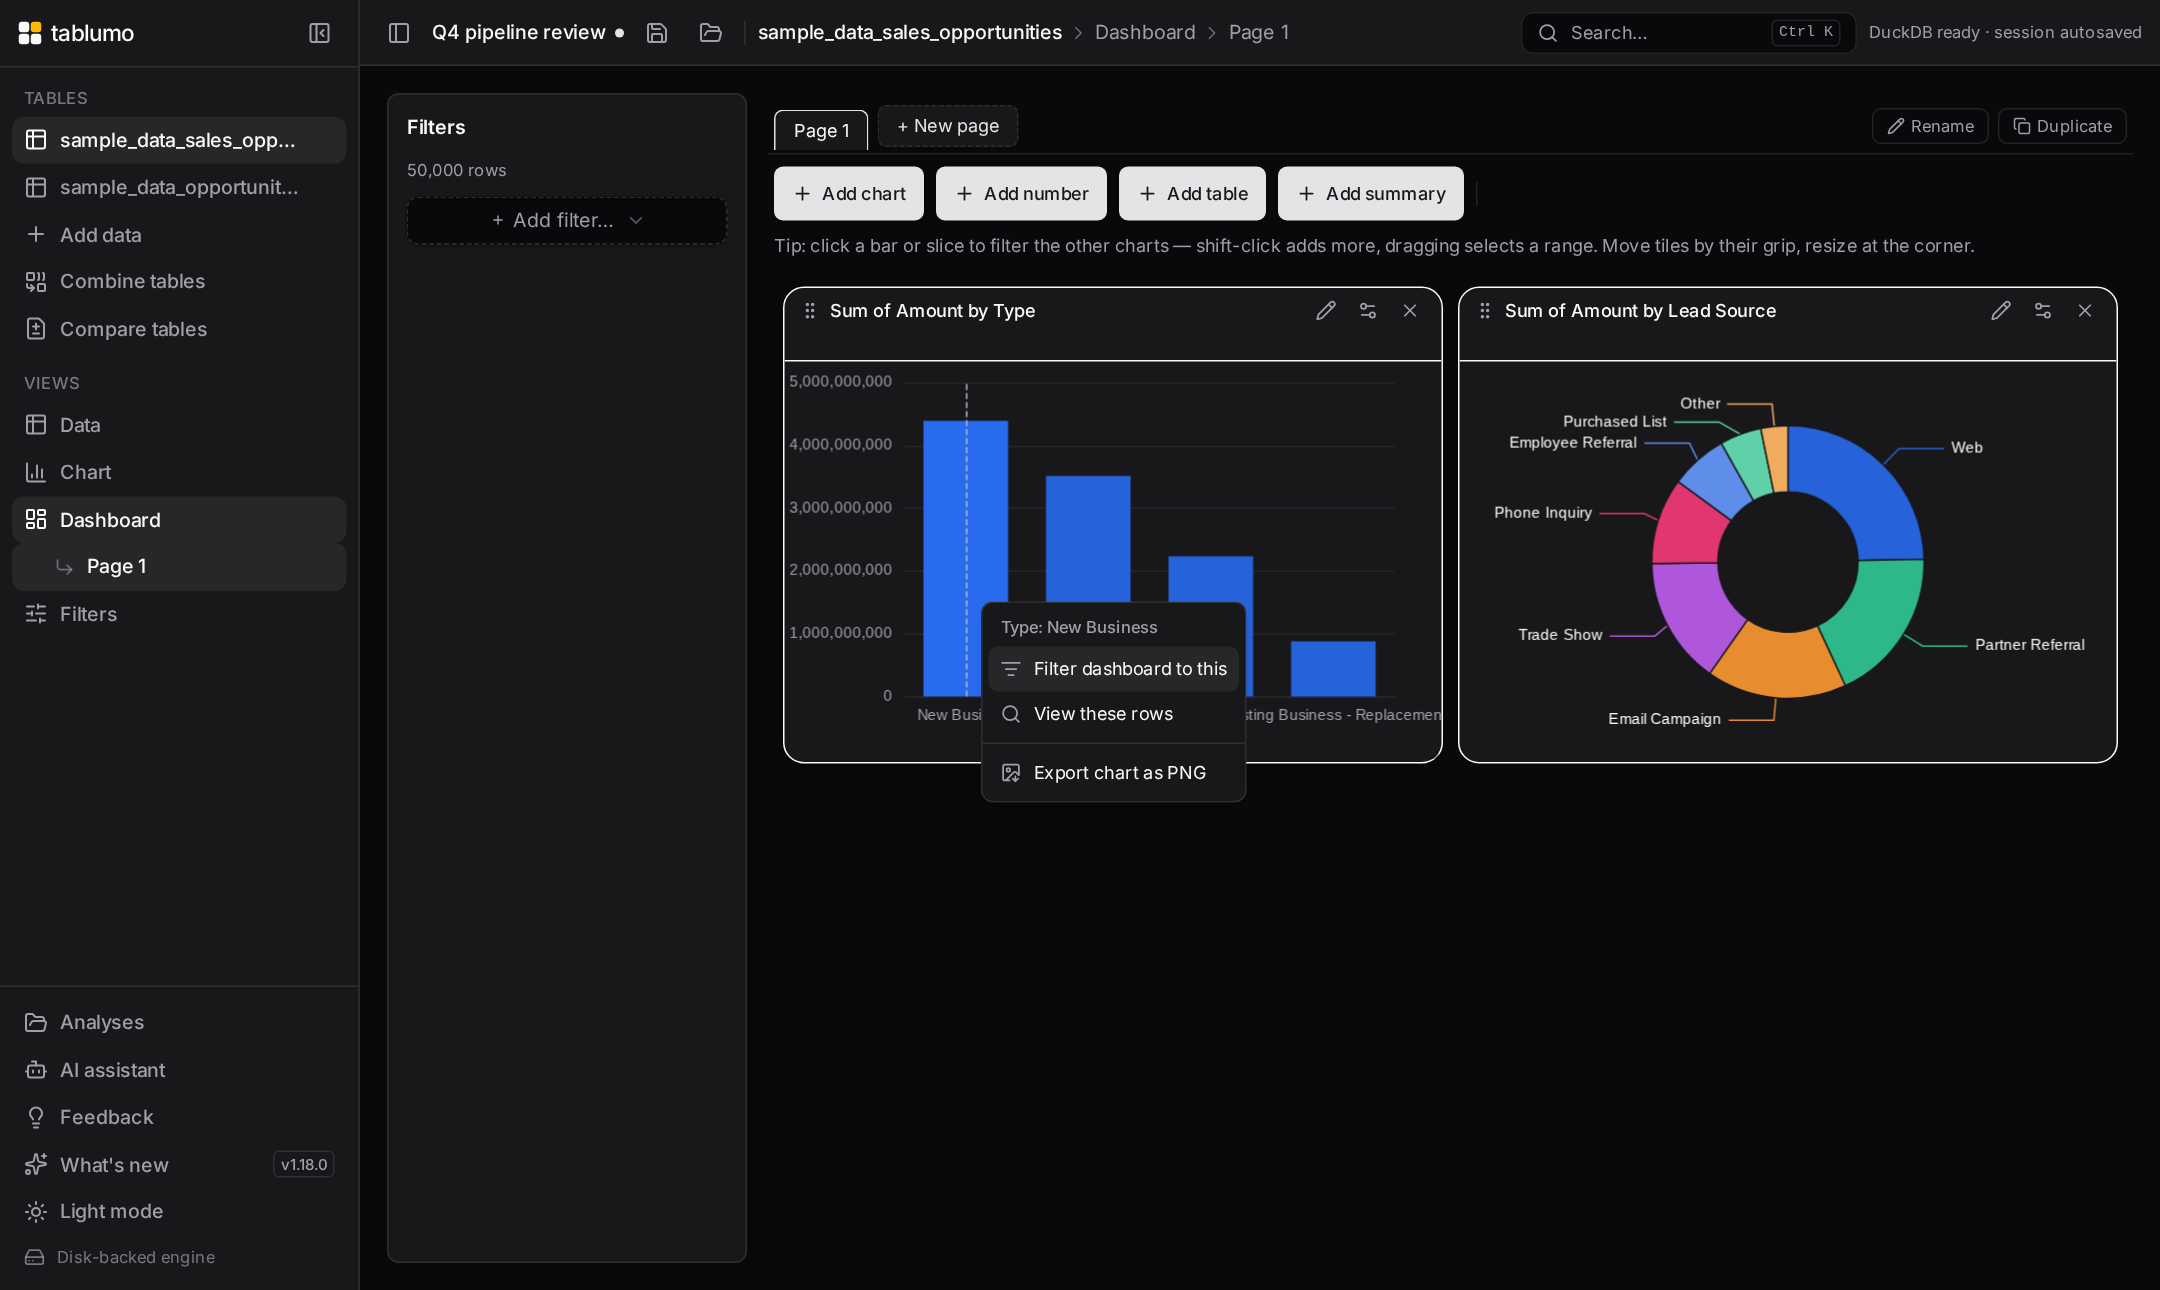
Build boards from chart, KPI, table and grouped summary tiles, drag and resize them freely, rename any tile to the words your team uses, organize them into named pages. Click any bar, slice or summary row and every other tile filters to match — table tiles show the actual rows (or a pivot-style group-by with sums, averages and counts, money formatted as money), each with its own column settings and CSV export. Summary tiles pin an honest grand-total row — computed across all rows in view, never just the visible groups — plus a subtotal per top-level group when sorted that way, and right-clicking any summary row (a subtotal, or the Total itself) opens the exact raw rows behind it. KPI tiles take a goal and show honest progress toward it. Right-click a tile to rename, duplicate, remove it or open the rows behind it — or right-click a bar or slice itself to filter the dashboard to that value, drill into its rows, or export the chart as a PNG.
🔍
Drill down to the rows
Any chart segment opens the exact raw rows behind it — click it, or right-click for the menu — precise counts, sortable, exportable, with per-chart column settings so each drill-down shows just what matters there. Box-drag on a scatter plot to inspect exactly the points you circled.
⛛
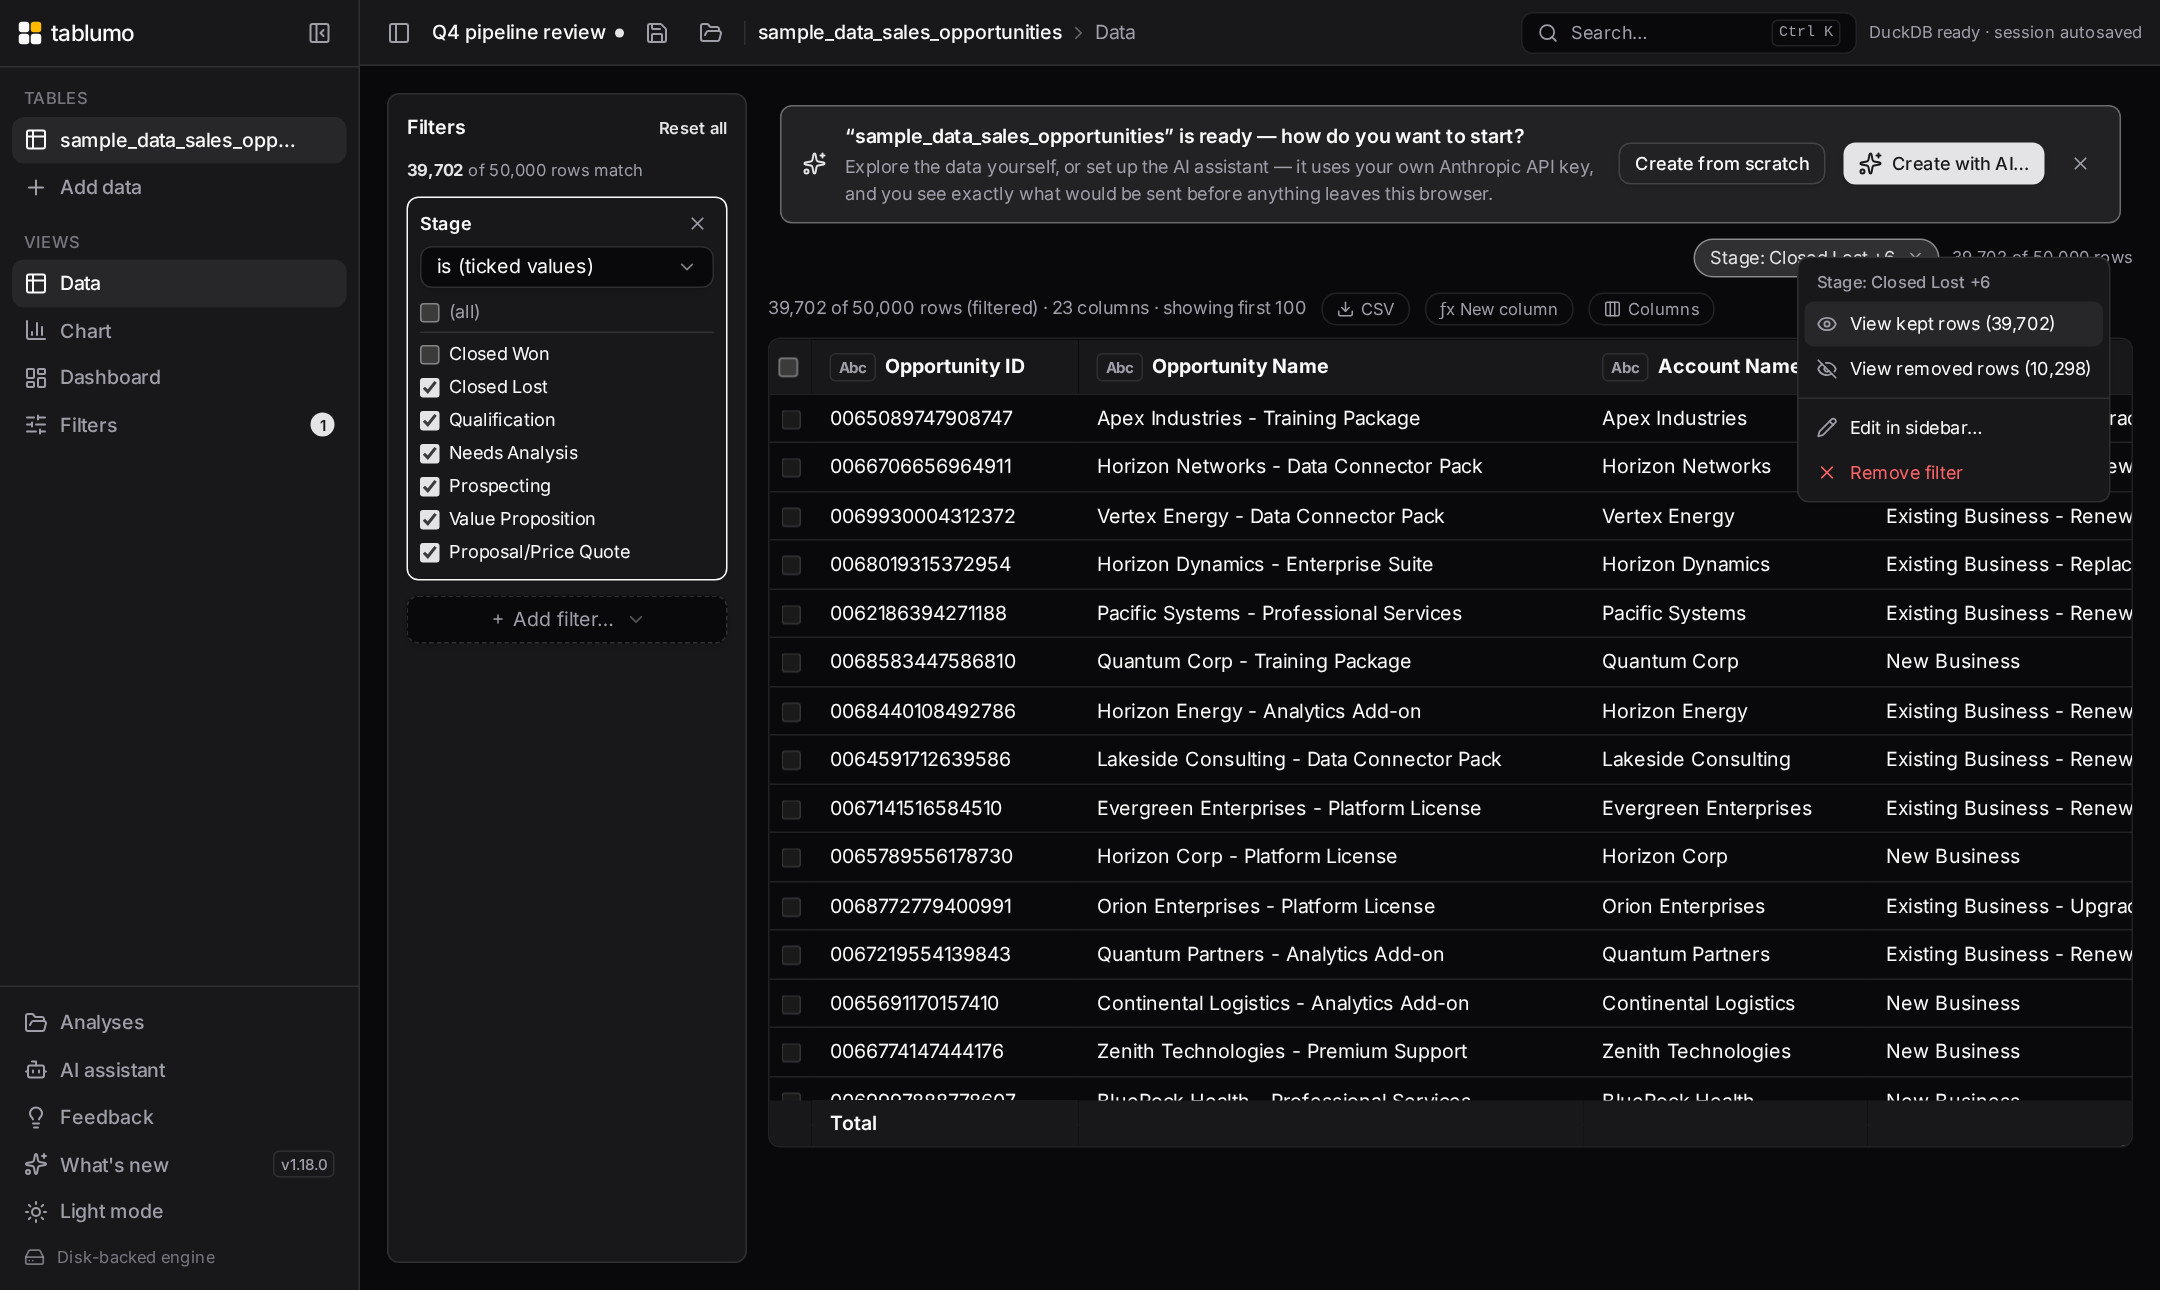
Live filters everywhere
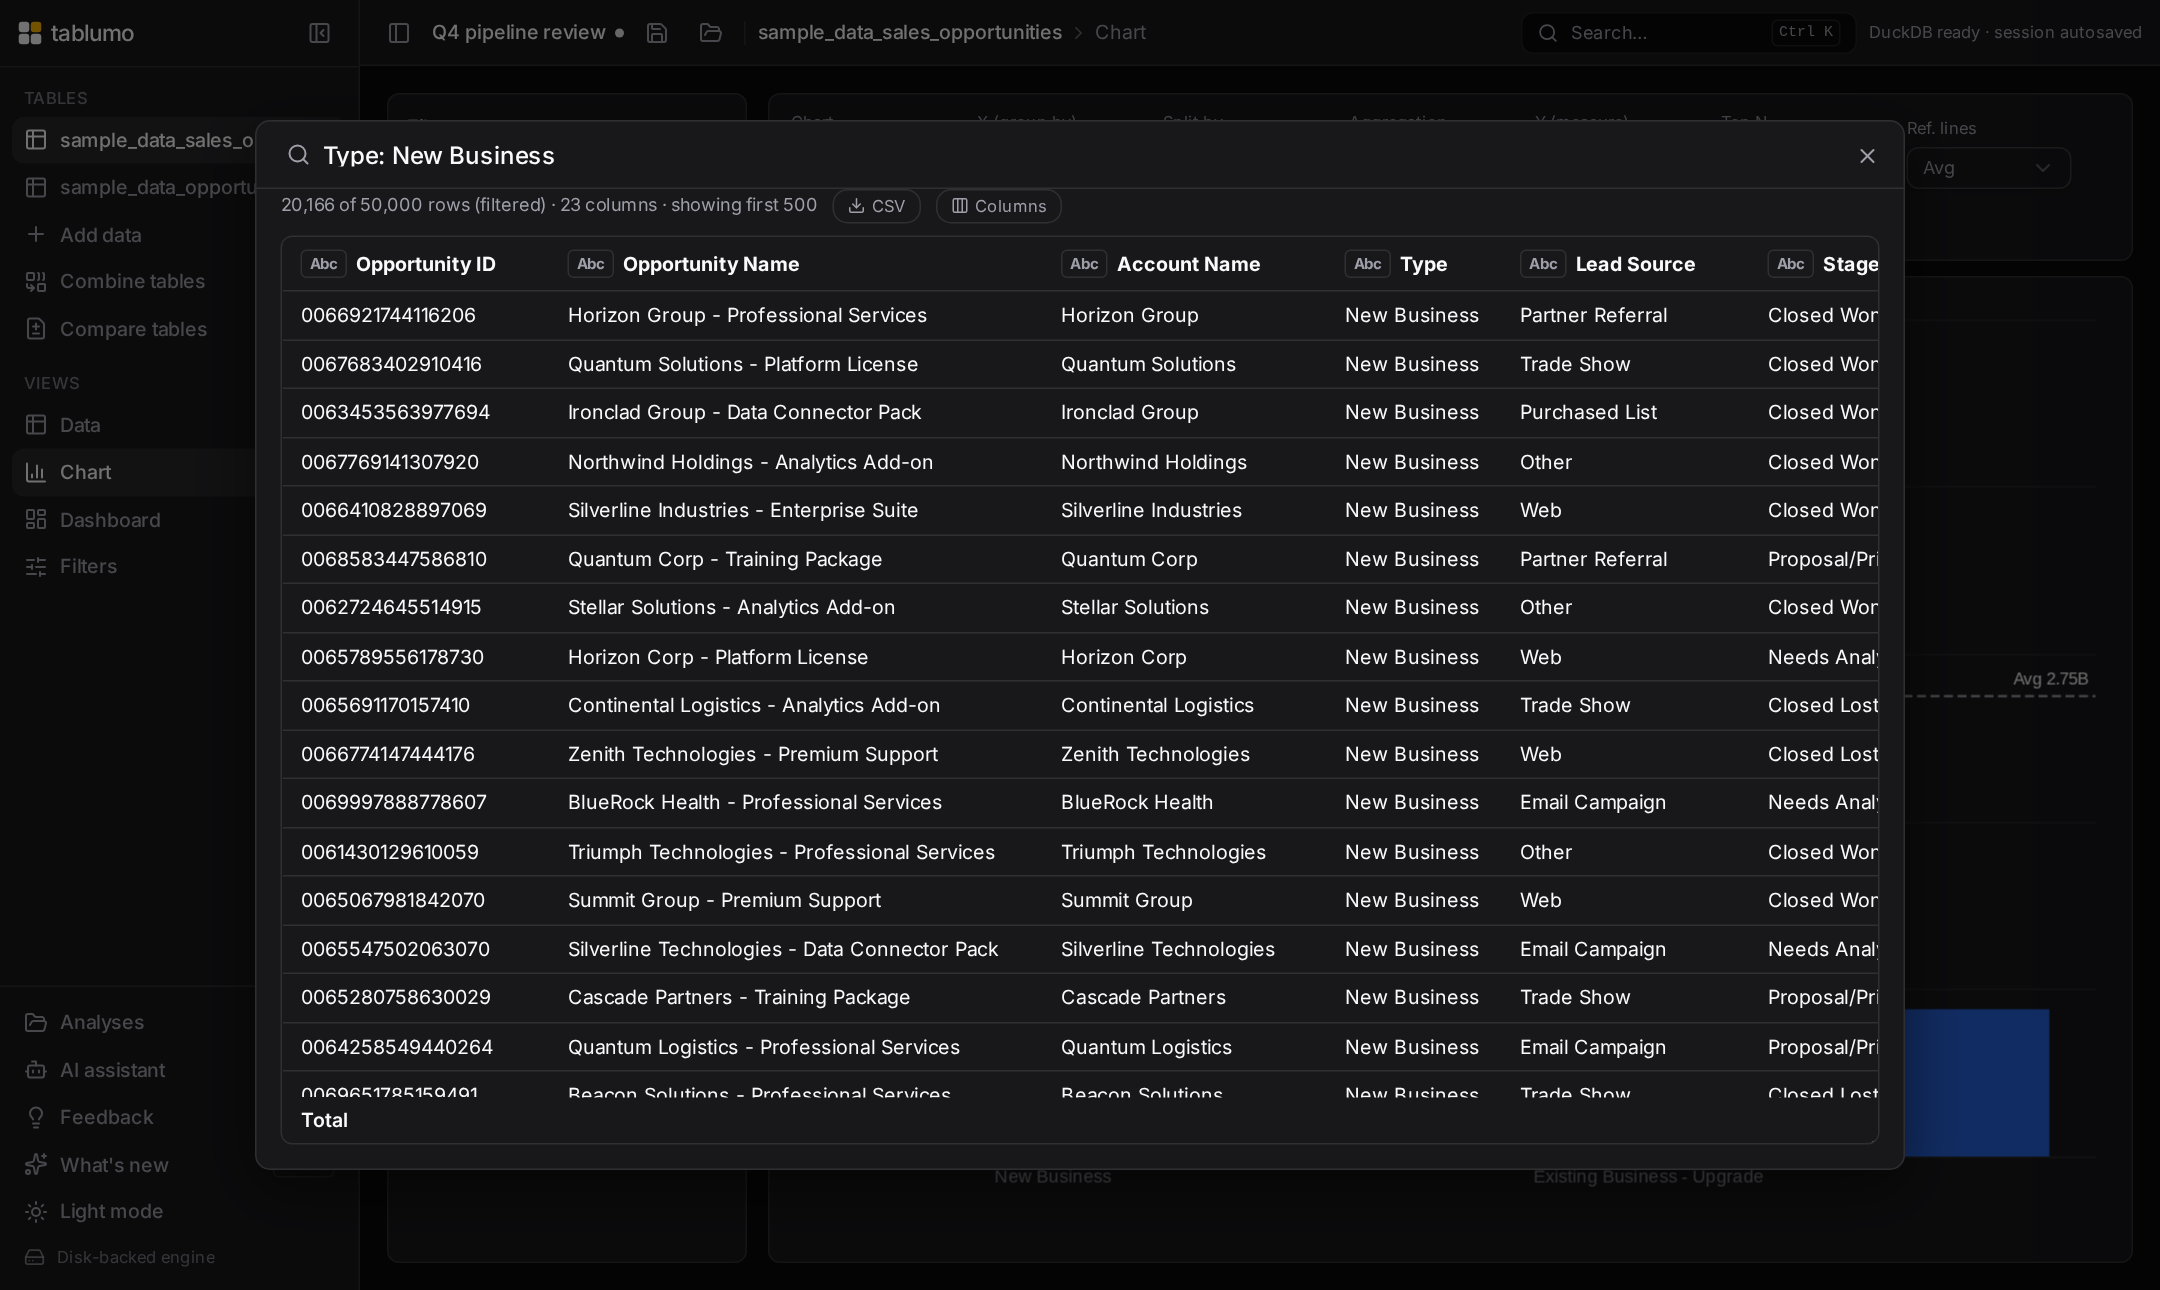
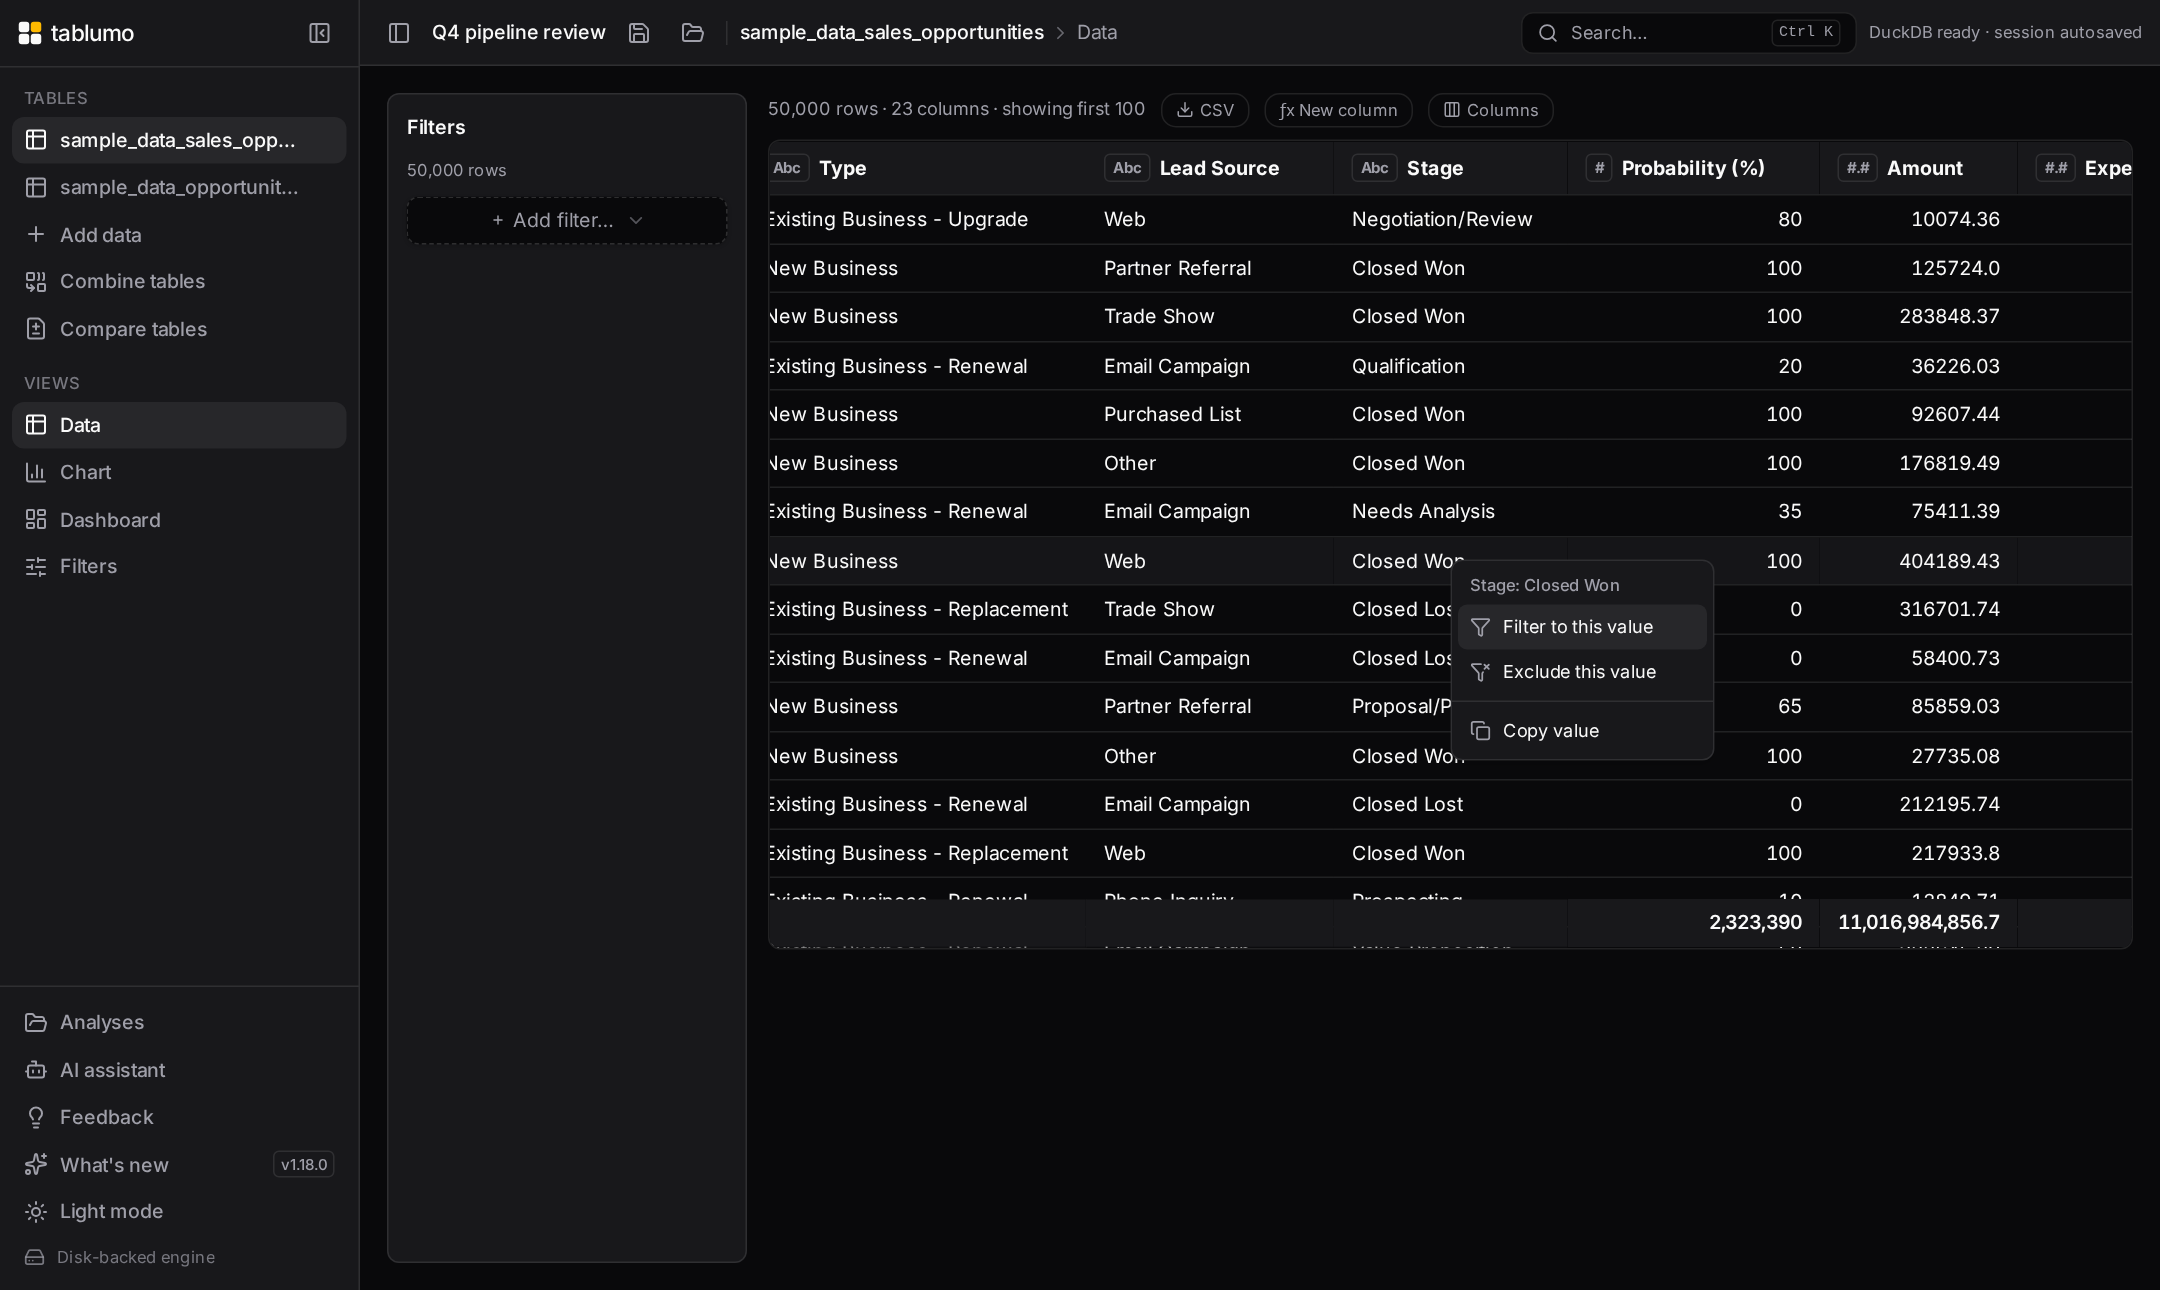
Type-aware filters (checklists, ranges, date pickers, text search) recompute every view instantly. Right-click any cell to filter to that value — or exclude it — and any column header to sort, filter, hide or group by that column for an instant pivot-style summary. Date columns display by month, quarter or year on request, with chronological sort kept. Active filters show as plain-language chips — currency columns read as money ("Amount ≥ €50,000"), and the sidebar's min/max boxes hint with your data's real bounds, money-formatted too — one glance tells you why the data looks like this, one click removes it. Right-click a chip to see exactly the rows it keeps — or the rows it's hiding. Value filters flip between "is" and "is not" in one click; text filters know "does not contain" — with blank values kept honestly, never silently dropped — and the same column can carry two filters at once. With several chips, every connector between them is its own AND/OR button, and a "Logic…" editor takes any nesting — "(1 OR 2) AND 3" — typed, or click-built from numbered chips, AND/OR/( ) buttons and a token-wise ⌫, with a live row count previewing the result before it applies. Tick rows in the grid to hide outliers or junk everywhere — a reversible mask with an honest "N rows hidden" pill, never a delete. Beneath the grid, a totals footer covers every numeric column over exactly the rows your filters keep — Sum by default, or right-click any footer value for Average, Min, Max or Count distinct.
ƒx
Calculated columns & currency display
Add new columns with SQL expressions and a live preview as you type — and edit any formula later by right-clicking the column, with the original restored automatically if the new formula fails. With the AI assistant on, just describe the rule in plain language: the model writes the formula, you see it, edit it, and decide. Right-click a text column to group values into buckets — "West Germany" counts as "Germany" — as an ordinary, fully reversible column. Format any numeric column as currency (16 currencies, or per-row codes from another column), display-only and reversible. Built-in currency conversion turns an Amount into "€1,234.50" at your exchange rate.
💾
Autosave & saved analyses
Close the tab and come back — everything is exactly where you left it, stored on your own device. Even multi-hundred-megabyte tables survive reloads now: they live in an on-disk database and re-attach in about a second, no re-import. Save any workspace as a named analysis and build a library organized in folders — the analysis name sits in the top bar with one-click Save and Open, and a dot warns about unsaved changes. Any analysis exports as a single portable .lens file (data included, big tables too) to move to another machine or keep as a backup. Export any view as CSV or charts as PNG.
⌘K
Command palette
Press ⌘K / Ctrl+K and type where you want to be: a table, a dashboard page, a column (it starts a filter for you), or an action like Add chart or Export CSV. Forgiving matching, ↑↓ + ↵ keyboard control — anywhere in your analysis in two keystrokes.
🌗
Comfortable to live in
A clean, modern interface built end-to-end on the shadcn/ui design system, set in Inter — real Cards, crisp vector icons throughout, light and dark zinc themes that follow your OS. Full keyboard-friendly sorting, undo for destructive actions, and an in-app changelog so you always know what's new.